


The Shock of the Great Crash
I like this article. It is replete with fascinating insights re a notable moment in (financial) history. And it is pithy.
posted by David M Gordon | 9:36 AM
![]()
Where the science of investing becomes an art of living

A private investor for 20+ years, I manage private portfolios and write about investing. You can read my market musings on three different sites: 1) The Deipnosophist, dedicated to teaching the market's processes and mechanics; 2) Investment Poetry, a subscription site dedicated to real time investment recommendations; and 3) Seeking Alpha, a combination of the other two sites with a mix of reprints from this site and all-original content. See you here, there, or the other site!


posted by David M Gordon | 9:36 AM
![]()

will play jazz (and jazz up the joint)
Caffe Divino
37 Caledonia St.
Sausalito, Ca
415-331-9355
posted by David M Gordon | 7:27 AM
![]()
posted by David M Gordon | 12:02 AM
![]()
posted by David M Gordon | 12:01 AM
![]()
posted by David M Gordon | 4:37 PM
![]()
posted by David M Gordon | 9:33 AM
![]()
posted by David M Gordon | 12:01 AM
![]()
posted by David M Gordon | 10:23 AM
![]()
posted by David M Gordon | 5:59 AM
![]()
posted by David M Gordon | 3:30 AM
![]()
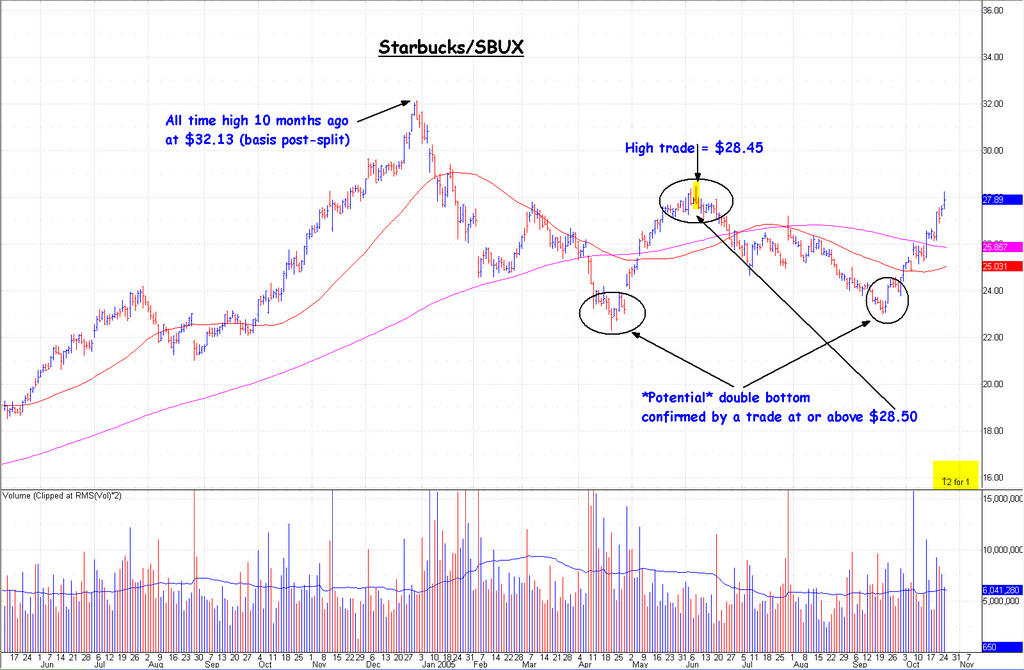 [click to enlarge]
The trade at $28.50 is the final holdout that transmutes this pattern from possible top to probable bottom. I have argued repeatedly that it (SBUX) is in the process of building a bottom, becoming more vocal (contentious?) the past month, as you know. No matter how long this base requires to complete itself, I see nothing but blue skies ahead.
posted by David M Gordon | 5:46 AM
![]()
posted by David M Gordon | 12:01 AM
![]()
posted by David M Gordon | 3:31 AM
![]()
posted by David M Gordon | 7:28 AM
![]()
posted by David M Gordon | 4:43 AM
![]()
posted by David M Gordon | 10:59 AM
![]()
 ~~~~~~~~~~~~~~~~~~~~~~~~~~~~~~~
Okay, that's enough to get me going. The very next item I do is check the long term chart; if the shown history is more than 10 years, I consult Big Charts...(See chart below.)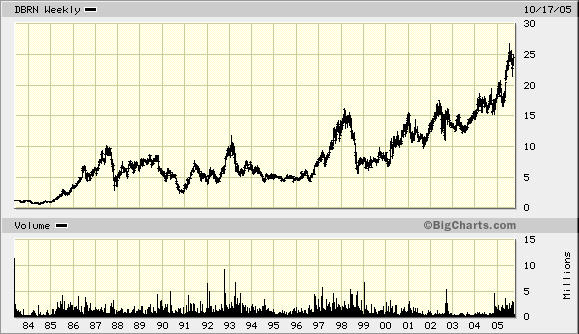
Dress Barn/DBRN required 22 years to rise from ~$1 to $25, so other opportunities have been more dynamic; if however, you prefer dependable long term growth with little grief, DBRN would have been a fine addition to your portfolio. And the fact is, the chart does look good; moreover, I have always liked this sector and group (respectively, retail and specialty retail). The next thing I do is check out the competitors' shares -- do they trade bullish or bearish? As it happens, I am familiar with and especially like Urban Outfitters/URBN, Coach/COH, Joseph Bank/JOSB, etc; each has the appearance of building an intermediate term base.
Next I visit the company's website, and begin my due diligence re the company (not the shares). Assuming it passes muster (it does), I finally check the daily chart...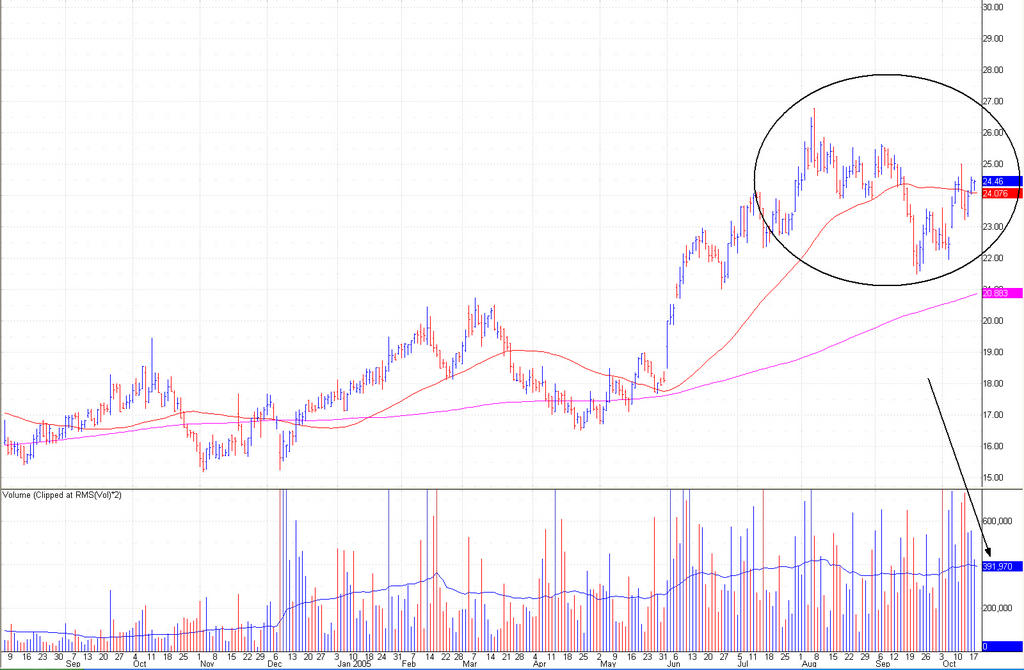
And now the opportunity begins to look especially tasty. It is building a base, likely 6 months in duration; thus, it is not quite midway through the process. Of course, the base might be of only 3 or 4 months in duration, so I do not drop it from my radar but instead add it to my monitor under budding set-ups.
I seek and would purchase:
1) A second decline toward $22-21 double support -- tested twice previously and the vicinity of the 200-day simple moving average (sma). (Also indicated as support by Dorsey Wright.);
2) A completion of the pattern based on time. This would occur during January/February.
Three caveats:
1) When buying retailers, you worsen the odds because you combine the whims of fashion with the vagaries of Wall Street. (I like those odds!)
2) Dress Barn/DBRN is not the leader of the specialty retailers; at this moment, that is likely Urban Outfitters/URBN.
3) Dress Barn/DBRN lacks liquidity (average daily volume) relative to others in the group, relative to the market, and relative to my (portfolio's) needs.
Thus, while I note the positive pattern abuilding for DBRN, I likely will purchase others as an investment. For example, Coach/COH, which is one of the few specialty retailers not subject to the whims of fashion because what they manufacture and retail is considered by many as timeless. (Arguable, I know.) While I might not invest in Dress Barn/DBRN, I will trade it, however. It weaves a pattern for future trading success!
A side comment about that pattern...
• During an intermediate term rally (trending up in price for 3 months or more), purchase pullbacks in price to the 50-day sma to capture future upside price momentum. When the pattern is an intermediate term base (trending sideways in price for 3 months or more), purchase tests of the 200-day sma.
• During an intermediate term price rally, the share price can approach or tag the 50-day sma many, many times; during an intermediate term base, the price should test the 200-day sma no more than twice.
In the former instance, you trade around the continuing uptrend (trade the trend's momentum). In the latter instance, you accumulate an investment position -- the first time down (test of the 200-day), should precede a bounce-back rally to a test and failure of the 50-day. The second time down is a test of the first test, thus building a double bottom within the intermediate term base. The pattern is near complete at this moment. The base typically is six (6) months because that is the difference in time between the two moving averages; when they converge (the Gordon Squeeze), the smart thing to do is close your eyes, hold your stomach, and buy the stock. (A third decline and test typically has bearish ramifications.)
I should mention this pattern is perhaps my favorite. It affords me the opportunity to invest in a long term winner (the market has already betrayed its proclivity) at a reasonable price, value, and substantially less risk. Other real time examples of this pattern include Corning/GLW, Genentech/DNA, Hansen/HANS, and the previously mentioned Joseph Bank/JOSB and Urban Outfitters/URBN, and many others including Google/GOOG (which is an especially shallow version of this base).
Questions...?
posted by David M Gordon | 6:23 AM
![]()
posted by David M Gordon | 2:54 AM
![]()

posted by David M Gordon | 12:57 AM
![]()

posted by David M Gordon | 5:59 AM
![]()
 (Please ignore the rsi indicator on the Bigcharts long term chart. I thought I was getting "strength relative to spx" like on stockcharts.com.)

posted by David M Gordon | 5:58 AM
![]()
posted by David M Gordon | 6:22 AM
![]()


 (I disagree with the interpretation of this chart as a cup & handle, but that point is immaterial to the greater argument. --dmg)
posted by David M Gordon | 12:29 AM
![]()
posted by David M Gordon | 8:47 PM
![]()
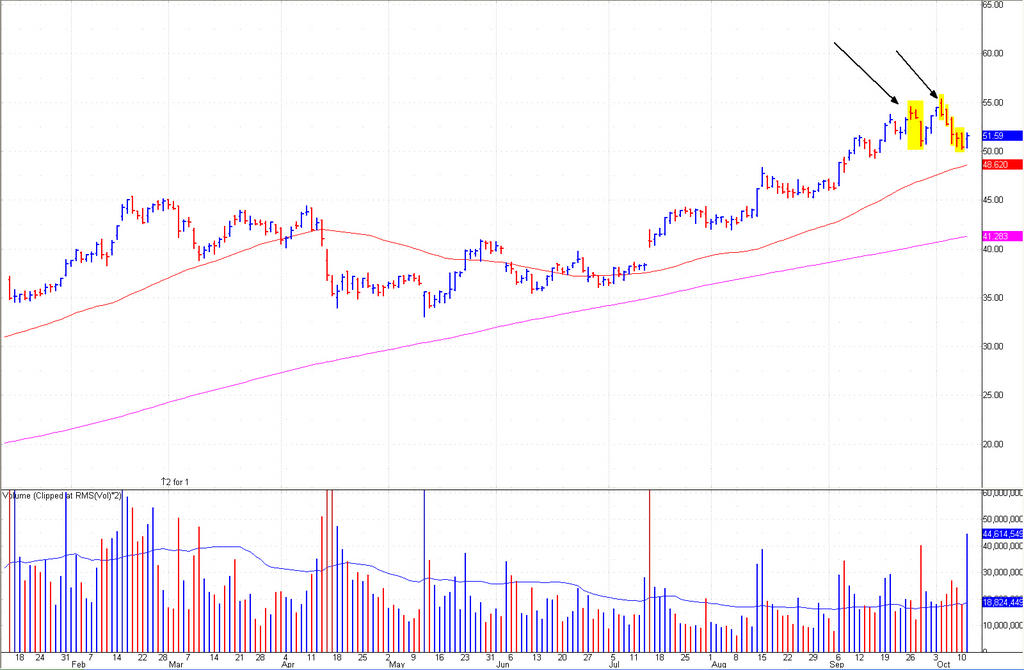 Note the reversal days (red bars in chart above): the stock opened on or near the daily high and closed on or near the daily low. Moreover, the weakness the past week (since the all time high) took the stock to a low beneath that of 28 September ($50.59). This is a technical no-no for an up-trend in simple peak & trough analysis, and serves to:
1) Create a pattern of lower highs and now lower lows;
2) Flatten the chart to (at best) a base from an uptrend;
3) Round off a top. The chart has the appearance of concavity (bearish in a rising trend) rather than convexity (bullish in a rising trend).
The best thing that could happen (post-opening tomorrow) would be a rally back to $48-50 based in part on tomorrow's 'surprise' corporate announcement and that the shares have been straight down since the all time high, setting up tomorrow's opening lows as the moment of "obscene weakness" (following a period of "extreme weakness"). My hopes for this rally back are not too high, however, as the pattern now is broken. Where it now trades (~$46) is just above the first level of support (~$45), then the rising 200-day sma ($41.30). Ouch, this hurt hurts.
posted by David M Gordon | 6:24 PM
![]()
posted by David M Gordon | 12:27 AM
![]()


posted by David M Gordon | 7:22 AM
![]()
posted by David M Gordon | 6:04 AM
![]()


posted by David M Gordon | 5:15 PM
![]()
posted by David M Gordon | 11:18 AM
![]()