Google

The Deipnosophist

Where the science of investing becomes an art of living

My Photo
Name:
Location: Summerlin, Nevada, United States

A private investor for 20+ years, I manage private portfolios and write about investing. You can read my market musings on three different sites: 1) The Deipnosophist, dedicated to teaching the market's processes and mechanics; 2) Investment Poetry, a subscription site dedicated to real time investment recommendations; and 3) Seeking Alpha, a combination of the other two sites with a mix of reprints from this site and all-original content. See you here, there, or the other site!

29 September 2006

Core inflation above target; not to worry?

The commentary that follows is by Scott Grannis, Chief Economist at Western Asset Management.
-- David M Gordon / The Deipnosophist
================================
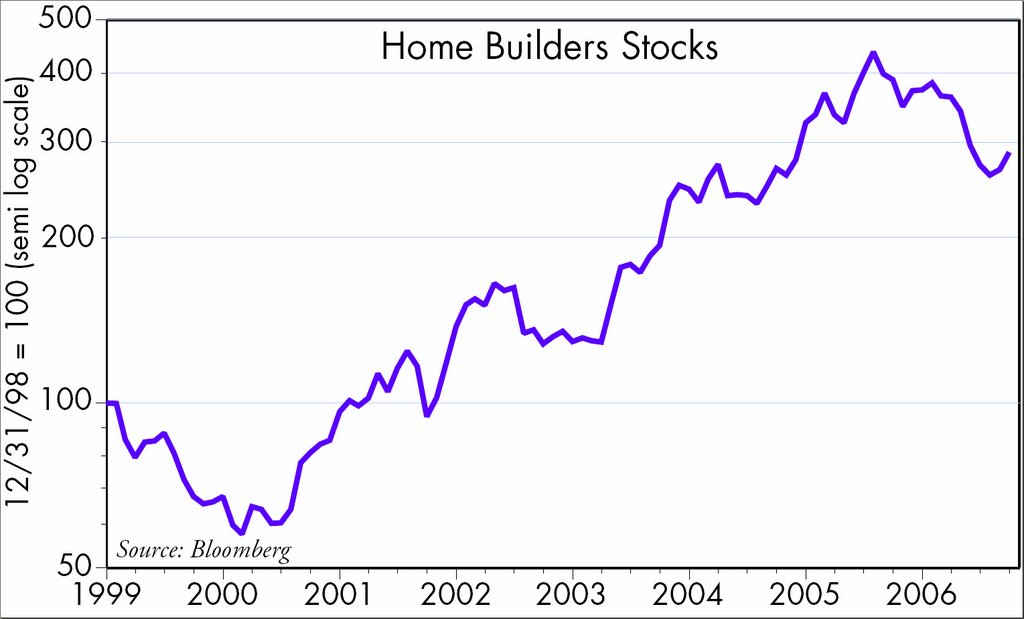
The bond market is dominated these days by the belief that the housing downturn that began a year ago will slow the economy by enough to reverse the otherwise troublesome increase in core inflation that we have seen over the past two years. So much so, in fact, that at least two Fed easings are expected next year. This belief rests on two key assumptions, however, both of which are not necessarily slam-dunks: Will the housing downturn slow the economy by enough to make a difference? And if the economy slows, will that bring inflation down?

To date he have yet to see convincing evidence of slower overall growth. There's been the odd sign of of weakness, in particular the Philly Fed index, which a few weeks ago dropped unexpectedly (but only to a low that it also hit in June of last year, when the economy was quite healthy overall). But there have been the odd signs of strength as well, such as today's release of the Chicago ISM index, which jumped unexpectedly to its highest level in over a year.

From a broader perspective, the news actually looks pretty decent: Weekly claims for unemployment show no signs of turning up, even though building permits nationwide have dropped 22% from January through August (if residential contractors are laying off people, maybe nonresidential contractors are snatching them up). The Challenger survey of layoff announcements has dropped 40% so far this year. Federal and state tax revenues continue to exceed expectations (strong tax payments reflect strong income growth and capital gains realizations). The Dow is at a new all-time high, and corporate profits relative to GDP have never been so strong (companies are about to launch massive layoffs at a time when profits are gushing?). Swap spreads show no signs of the rising systemic risk that has preceded significant economic downturns in the past, and high-yield spreads are close to their all-time lows. Atlantic freight rates are up 70% so far this year, and industrial commodity prices are within inches of their all-time highs (i.e., the global economy remains strong). If almost five years of rising energy prices have been a drag on growth, it's good news that oil and gasoline have reversed all of the price hikes of the past year, and natural gas is back to 2003 levels. And if higher mortgage rates proved to be the tipping point for the housing market, it is worth noting that rates have already reversed almost half of their rise from last summer's lows.

Apart from a predictable downturn in headline inflation that results from a sharp drop in energy prices, we haven't seen any evidence that inflation in general is cooling. Indeed, the fact that core measures of inflation have been rising for the past three years suggests that monetary policy to date has effectively accommodated higher energy prices, allowing them to find their way into other prices. If the Fed had been tight, higher energy prices would at the very least have resulted in nonenergy inflation falling, not rising. Gold prices have tended to be a good indicator of broad inflation trends, and gold today is about 30% higher than it was a year ago, and 60% higher than it was three years ago. Big downturns in the economy and inflation have typically been preceded by a significant increase in real yields (i.e., a major tightening of monetary policy), yet the real yield on the Fed funds rate is only about 2%, and the ex-post real yield on 10-year Treasuries is less than 1%.

We may yet see a weaker housing market eat away at the foundations of the broader economy, and we may yet see inflation fall with little or no help from the Fed, but these are still big ifs that the bond market seems to be ignoring.

Caveat emptor, as they say.

Labels:

Hawaii Wish List

The message below is from a long-time friend, Jack Cory; several of you might recall him. In this snippet from his most recent email, he tells me what has occupied his time of late. I post it here for those with similar interest...
-- David M Gordon / The Deipnosophist
================================
Hi again, it's me! You know, that guy about whom you used to ask, "What ever happened to ... ", and then he just disappeared over a programmer's horizon.

After many months of working on my new website, Hawaii Wish List, I have finally conceded that it is as done as it's going to get - for awhile.
There are still more things that need to be designed and built but I believe that the site is now complete enough to begin to approach advertisers for inclusion. All of the potential advertisers are companies that provide services to Hawaii tourists.

Why has it taken so long, since I am otherwise unemployed? Well, there are all those trips this old guy has to take to visit doctors. Then there is the fact that although I have been a programmer for decades, until I undertook this project I had never ever written even a single line of code for the web. Also, and this is a considerable task, I wrote all of the text for the entire site (except for the Molokai page.) I am actually a very slow writer, made even slower by the fact that I edit every word many, many times.

On the homepage you will find a blank space under the How To Use This Site heading. I will fill this in later after I have completed the next phase of items to be added. I also may change the design of the pages somewhat in the future. In looking at the pages for each island please consider that Maui is the model for what the others will be.

I have yet to release the site to the search engines but will do so once we get some advertisers on board. In order to reach the site you have to use
the direct link.

Your comments, corrections, and critiques will be greatly appreciated. I hope you like it - at least a little.
Jack

Labels:

28 September 2006

Trading Smarter

Interesting paired interviews, in which, "Schwab Chief Trading Officer Greg Miller sat down and talked with one of the most respected names in technical analysis, Martin Pring (a long time acquaintance -- dmg), to get his thoughts on how active traders can improve their trading outcomes in today's volatile markets."

Part 1 in its entirety and Part 2, in which "CyberTrader Chief Market Strategist Ken Tower recently conducted a follow-up interview with Martin Pring ... to learn more on how traders can trade smarter in today's volatile markets."

For a long while now, I have regarded Marty with the highest professional esteem.
-- David M Gordon / The Deipnosophist

26 September 2006

Housing - a contrarian view

The essay below is by Scott Grannis, Chief Economist at Western Asset Management.
-- David M Gordon / The Deipnosophist

================================
I'm always willing to entertain a contrarian view, and if there's anything that is contrarian these days it's the belief that the US housing market collapse is yesterday's news. I would venture to say that the vast majority of observers believe that the housing market won't hit bottom for another year or two; that housing prices have only just begun to decline. I'm sure that a lot of people worry that a big decline in home prices could really hurt the economy over the next year--a hard landing scenario.

But it is also true that the bursting of the housing bubble has been very widely anticipated and thoroughly reported. Maybe we've seen the worst. Maybe we should be looking "across the valley" to a recovery. Maybe the economy is not going to be so weak next year that the Fed will be forced to cut rates three times, as the bond market is now assuming.

Mike Bazdarich notes that California housing permits have fallen by about 50% in the past year. "Some real estate investor types are optimistic about these data, because they think that builders have cut back faster than demand, supposedly paving the way for the market to rebound once it bottoms out."

The chart (below) reinforces that view.


An index of home builders stock prices peaked over a year ago and bottomed out in July, about the time the housing collapse became official. Despite the drumbeat of bad news in recent months, this index is up 20% from its recent lows. Not all the news is bad, and you can't wait for newspaper headlines to tell you what is happening to the economy on the margin. Something to think about.

Labels:

Behind the scenes

I received many, many requests (well, okay, if you twist my arm, really only 2 or 3 :-) about my composition of the photos in "dmg returns." So I thought I would share snapshots of me in action. Each was snapped by a friend, Zara Elis. And without me knowing - imagine that! (btw, click on each image to enlarge.)

Scoping out the action for photo possibilities at Plaza Carnot in Toulouse.


Place de la Comedie in Montpellier

Here I stood, finger on the shutter, patiently awaiting a pigeon to alight.

Why stand when I can kneel?


You will recognize Montpellier as the location for these next 3 snapshots.


As for that bunching in the back of my shirt, it comes from the backpack rubbing against it during the treks. I seemingly am wholly incapable of ridding the shirts of it. If anyone has a suggestion on how to rid my shirts of this 'error message' -- I am all ears.

Thank you again for all you public and private comments and compliments. I guess I must hit the road again soon, camera in hand!
-- David M Gordon / The Deipnosophist

25 September 2006

Now

... is as good a time as any (in fact, better than most because the passage of 6 weeks has proved me correct! :-) to reveal the company name/symbol of this post ("Base... or Top?"). It is Cameco/CCJ, the uranium company.

Ah well, so much for that bull market! Note the sympathy declines in former "leaders" BHP and RTP. And the rest of this sector.
-- David M Gordon / The Deipnosophist

Google/GOOG - UBS Securities

Meaningful monetization improvements in Q3;
notable improvement this year

UBS Securities says looking at Google's short history as a public co, there have been meaningful monetization improvements in Q3. The firm's analysts state that while Q3, at an industry level, is a seasonally weak quarter, GOOG Q3 quarter vs quarter net revenue growth has been impressive. They believe, "Is there a meaningful monetization improvement in Q3 this year?", is an important question for the stock in the short term.

While not as obvious as some improvements in the past, there are notable improvements this year. The analysts note the two important to them are:
1) the Landing Page Quality update, and
2) a keyword and ad text quality score change.

They further say the basic impact raises minimum bids for advertisers and note that quantifying their impact is difficult; that there are monetization improvements this year, but believe they are unable to quantify accurately their impact. The analysts advise investors to remain on the sidelines.

For the complete report, please email your interest.
-- David M Gordon / The Deipnosophist

Labels:

24 September 2006

dmg returns...

(And the people of France rejoice on hearing the news of his departure! :-)

Below are a handful of photos, sufficient perhaps to whet your interest in sharing my travels through France, albeit vicariously.


[click on each image to enlarge]

You can view more photos by finding the appropriate links in the sidebar. Of course, your comments are welcome, as always!

By the by, it turns out that 3 weeks of walking here, there, and everywhere means I have forgotton lots of items -- such as how to drive. If you live near me, I suggest you grant me wide berth. At least for the next several days!
-- David M Gordon / The Deipnosophist

04 September 2006

Away again

I am off to France. I will return 24 September 2006, barring any mishaps.

For those curious, most of my time will be spent trekking in the higher-altitudes of the Pyrenees, especially the former strongholds of the Cathars. "Former" because

1) The Cathars existed hundreds of years ago, and
2) The Church sent in its shock troops and exterminated this religious sect to a one.

And, yes, I will snap many, many photos, and then upload them to my online album. (Link in the sidebar.) Thank you for asking.

Best wishes (which includes profitable trading!) to All,

-- David M Gordon / The Deipnosophist

I was wondering....

A reader -- and a particularly savvy investor (who prefers to remain anonymous) -- writes to ask...

"The techs are in gear. [And yet] GOOG hasn't participated. Yesterday they announced a potentially very important alliance with Apple. But the stock didn't react at all. The moving averages are beginning to roll over (emphasis on BEGINNING). The volume characteristics don't look very good on the rally back from the gap resistance. The price/volume on the Weekly (chart) looks pretty sick. The RS (relative strength) keeps falling. On a purely technical basis, it doesn't look good to me. What do you think?"
Yes, I see all that, and more. All very disturbing, to be sure. In fact, I have been warning throughout this year that 2006, and perhaps longer, would manifest on Google/GOOG's chart as inside bars on a long term chart. Most recently, for example, was this alert.

[click image to enlarge]

Delineated on the chart above, are three trend lines. The flat line (green) represents the short term trend and captures the oft-mentioned support at ~$360, which it has yet to breach. The intermediate term (past 1 year) trend line with the minor upside tilt (red) shows many specific data points of both support and resistance; it is a line that warrants attention. And the longer term trend line (blue) captures many data points of support and resistance as well; it also is the line that would be breached first, as its current placement (~$369) is immediately beneath recent prices. These lines could be broken, and the long term up trend would not change; that event would not occur until the price breaks beneath the long-argued ~$330. Until that event comes to pass, the shares remain in a high level consolidation, bounded by ~$450 on the high and ~$330 on the low. Traders will trade these two extremes.

Yes, I see the many area patterns in the daily, weekly, and monthly charts; many of which I previously have limned here. I could show them again, but when a stock is caught in a high level consolidation, as has been the case for Google/GOOG the past 8 months and counting, patterns, trend lines, and moving averages matter little. What does matter are fundamentals and valuation. So long as Google/GOOG's fundamentals continue to improve, its valuation too will improve as the stock tracks sideways. And then the sole remaining criterion is your conviction...
• Does the company remain a leader in its business, the economy, and the market?
• Do you believe, as I do, that Google/GOOG is more than a one-season wonder?

Look down; you stand before the hard, right edge of the chart. The future remains, as always, unknown and unknowable. Whoever said that being a long term investor is easy?
-- David M Gordon / The Deipnosphist

The Risk Pool

The always redoubtable, Malcolm Gladwell writes about the crisis in our pension plans in another typically fascinating essay...
America’s private pension system is now in crisis. Over the past few years, American taxpayers have been put at risk of assuming tens of billions of dollars of pension liabilities from once profitable companies. Hundreds of thousands of retired steelworkers and airline employees have seen health-care benefits that were promised to them by their employers vanish. General Motors, the country’s largest automaker, is between forty and fifty billion dollars behind in the money it needs to fulfill its health-care and pension promises. This crisis is sometimes portrayed as the result of corporate America’s excessive generosity in making promises to its workers. But when it comes to retirement, health, disability, and unemployment benefits there is nothing exceptional about the United States: it is average among industrialized countries—more generous than Australia, Canada, Ireland, and Italy, just behind Finland and the United Kingdom, and on a par with the Netherlands and Denmark. The difference is that in most countries the government, or large groups of companies, provides pensions and health insurance. The United States, by contrast, has over the past fifty years followed the lead of Charlie Wilson and the bosses of Toledo and made individual companies responsible for the care of their retirees. It is this fact, as much as any other, that explains the current crisis. In 1950, Charlie Wilson was wrong, and Walter Reuther was right. The key to understanding the pension business is something called the “dependency ratio,”...
The complete article appears here; it earns my strongest recommendation as being worthy of your attention. Heck, any essay that can tie together pensions, Ireland, Africa, China, India, and dependency ratios into a cohesive, coherent, and cogent whole has my vote!

-- David M Gordon / The Deipnosphist

03 September 2006

Time Stop

The article below elucidates in additional depth a topic I mention often -- using the too often ignored x-axis. It was published originally in The Worden Report of May 2003.
-- David M Gordon / The Deipnosophist
=================================

Time Stop
Don Worden

Yesterday I promised you a tactical answer for what, many years ago, I had termed the trader's ultimate dilemma. When a stock breaks strongly to the upside from a trading range, what do you do? Do you chase it? Or do you wait for a pullback. If you opt to wait for a pullback, how do you decide just how far it should pull back before you will buy it?

The dilemma is this: The stocks that do not pull back will prove, on average, to be the stronger stocks. The stocks that are cooperative and pull back to, say, the breakout point will prove to be inferior performers compared to their less cooperative buddies.

Most investors wait for the pullback and buy at the breakout point. Consequently, over time, these investors look back and find they have, for the most part, been holders of middling stocks. Some of these stocks, after welcoming all comers at the breakout point actually continue on down, down, down. Others put the breaks on and embark on the upward journey foreshadowed in the breakout. But ultimately they seldom compare to the dazzling performances turned in by some of those who, once out of the gate, never looked back.

In this situation, as in other market situations, it occurred to me that we devote our attention almost exclusively to the Y-axis, neglecting the X-axis like a used milk carton. Think of the terminology we use. Support and resistance. We are referring to price levels on the Y-axis. Loss-cuts. Buy on stop. Stop-loss points. Even trendlines are essentially measures of rates of ascent on the Y-axis.

What about the X-axis? What does it measure? It measures TIME.

Can we harness TIME as a tactical measuring device, the way we harness price movement? The answer is yes, and in so doing we can protect ourselves from much of the markets uncanny ability to mislead us. The market is always throwing fakes at us, luring us into making decisions that we simply don't have the facts to justify.

When a stock breaks upward from a base, we don't have the necessary facts to know whether this will be one of the flying darlings we want, or is it a shabby pretender. A golfer would equate the breakout to the initial drive on a hole. It's long and straight. It has promise. But as many a golfer has learned the hard way: You drive for show, but you putt for dough.

Since we lack the wherewithal to make a rational decision, second best is to be sure of not falling into a rut that produces uniformly mediocre results. No, we don't want to buy everything at the breakout point every time we get a chance. No, we don't want to chase these things and lose them in the clouds. And yes, wouldn't it be nice if we could pick up a few of those that pull back very deeply, well below the breakout point itself.

What we really need is a RANDOM method of entry. A method that ignores the market's little tricks.

Now remember, this is only a method of entry. We already have a list of reasons why we want to buy the stock. But we don't want to look like spastics getting on an escalator. We don't want to wind up hating ourselves for making lousy decisions. Instead, well leave it to fate and destiny. Because thereby well get a fair shake on average. And I mean literally a fair shake.

Get yourself a die (singular of dice). After the breakout, throw the die once. That tells you when you're going to buy this stock. A one for tomorrow, two for the next day, etc. -- up to six days.

Throw it again. This is for which hour of the trading day to buy the stock. (From one to six).

These are rules you have to customize for yourself. Maybe you want to buy within three days under any circumstances. Maybe a one to three means buy on the open and a four to six means buy on the close. If you want to use a three-day instead of a six-day span, throw until you hit a number between 1 and 3.

And, of course, there are many ways to generate random numbers. Your computer has a random number generator. I sort of like the dice. They're more romantic.

I call this TIME STOP.

You are buying at a small window in TIME - REGARDLESS OF PRICE. You are using the X-axis for signal points instead of the more common Y-axis. On breakouts, sometimes you will buy above the breakout point, sometimes below.

Ah, but enter common sense. Obviously there is some level above, beyond which you don't want to enter. And also obviously, there is a point below beyond which you do not want to buy. So you must set limits. On the upside, this may be something like ten, or 15 or 20 percent. It may be a volatility modified percentage. Same on the low side, although in many cases a natural loss-cut point works best. Imagine seeing your loss-cut point broken when you haven't even bought it yet.

Yes, some of the time you're going to get lucky. You deserve it. Other times you are going to get unlucky. But always within limits that you set yourself (before you open the trade). You have the ultimate control and you can stick your tongue out at the market's little tricks. Because you are guaranteed one thing on average, THAT'S A FAIR SHAKE.

The rules you choose for the die shakes can be customized to each separate stock venture, providing you do it before you buy. After you're in it, do not change the rules - PLEASE. However, there is an exception. If the stock should change character for the worse while you're waiting, you can scratch the trade like racing horse before post time. And you don't have to feel you're cheating. (But don't do it too often.)

I should mention that this is not the first use of the X-axis as a tactical tool. In his first book, back in the 50s, The Battle for Investment Survival, Gerald Loeb pointed out the wisdom of diversifying in time. He was referring to setting up a portfolio over a period of time - adding to them at intervals. Also, the technique known as dollar averaging is an X-axis strategy.

Incidentally, the TIME STOP concept itself has other applications in the market. It's very useful for devising exit systems. But that's another story for another time.

who's online