


The role of Volume:Price
This first chart (below) shows again the item that Ray Fairfax and I first shared ~2 months ago: that the Relative Strength (RS) line as computed by Daily Graphs reaches new highs (see 1) before the stock price; this type of action typically is quite bullish.
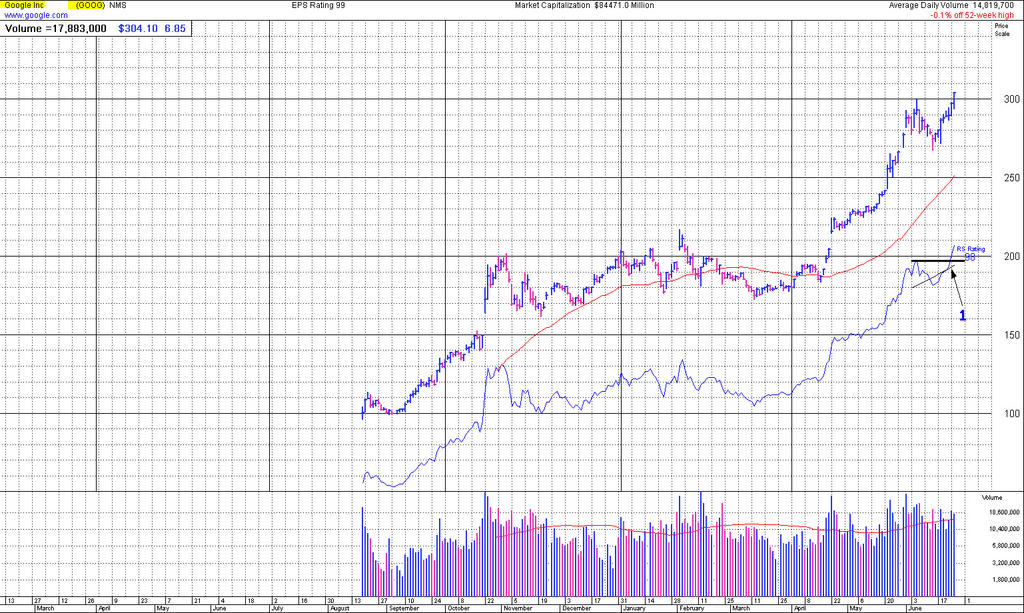
[click to enlarge]
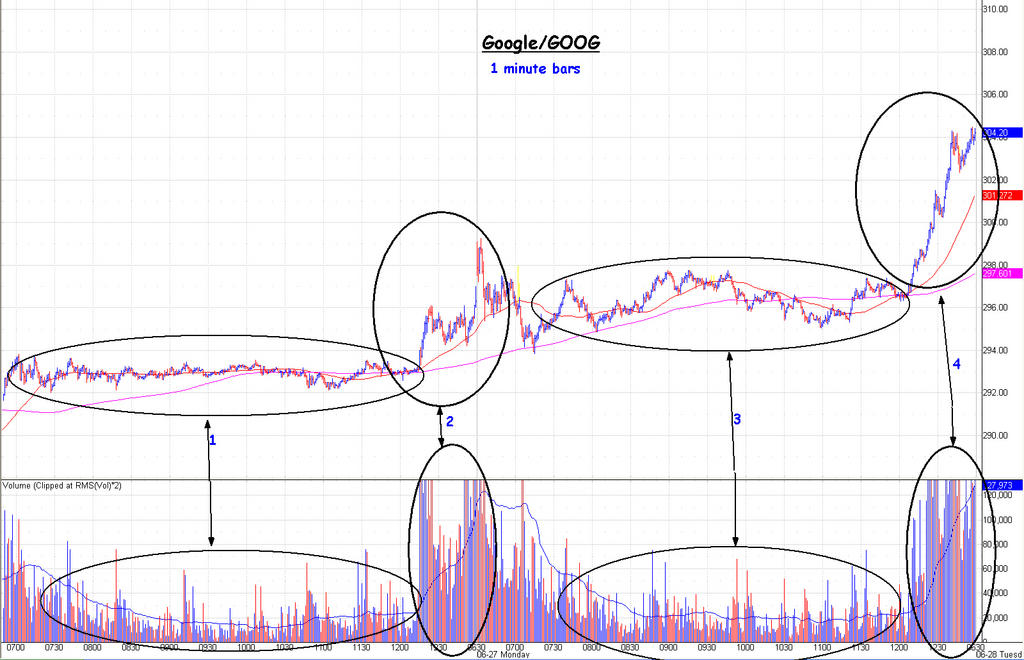
This second chart (below) highlights what I want to share this morning -- the relationship of volume to price...
[click to enlarge]
Note that during bases 1 and 3, volume and activity diminished, and that when the price rallied (see 2 and 4), volume expanded, at times explosively. The squiggly line in the volume study is a 50 unit simple moving average (sma) of volume, so in this study it equals 50 minutes. Even though moving averages are a derivative of the study, they have a purpose. (This is not the post to share understanding of moving averages, etc.) In the 1-minute bar chart above, it acts as confirmation of the aggregated single bars and it helps to isolate specific bars (both volume and price) that require deeper study.
When the four critical components (as I deem them: price, volume, pattern, and trend) are in alignment, then reducing your perspective to the intra-day periodicities (such as the 1-minute) will help guide you to the inception of a move at the best price and moment. Of course, this requires that you monitor your opportunities on an intra-day basis, something not everyone is willing to do, nor is it everyone's time frame. (I, however, prefer to fill at the best price possible at the moment of action.)
All this mean that, for Google/GOOG, all systems remain "go"; there is nary a sign of reversal in sight (as I have oft-stated).
In addition, there is an article available for reading at the NY Times (At $300 a Share, Google Looks Pricey and Still Irresistible) that is the typical equivocating journalistic pabulum; jabbering much, while saying little. If interested, go here.
And one final time, a snippet from Tim Villano's morning market comments...
"While the current timing sequence suggests that holding of last Friday's lows provides an opportunity for recovery and support into July 11, longer-term intraday patterns are now negative, which argues that further reaction lows in the (SPX 1185-1180) range cannot yet be ruled out. The Cash must rally back to the (SPX 1211) mark or higher to turn the pattern neutral. This will depend on confirmation of a topping pattern in Crude.From a bigger picture standpoint, recovery for the tape into the week of July 11 appears to be a selling opportunity and perhaps a signficant change in market psychology in line with the notion of a topping process."
posted by David M Gordon | 4:52 AM
![]()
<< Home