


Meaninglessly random... Or randomly meaningful?
"Please help me - help us! - see what you see; how you see it, when you see it, real time, as it unfolds..."Well, doing so is well beyond the capability of this type of venue. I could, however, take a longer term perspective that might help. To keep it simple and the charts uncluttered, I will use only one tool, trend lines. (Apologia: in the charts that follow, I erroneously included the simple moving averages; please ignore them in favor of this post's true purpose.)
First things first: each chart is of Chipotle Mexican Grill/CMG. Please review this site's archives for my previous recommendations of CMG as an investment. In those earlier posts, I examined the company's fundamentals. This post serves a different purpose, so I will limit my comments to the stock; however, please recall that this company lies at the front end of its S curve.
 [click on each chart to enlarge]
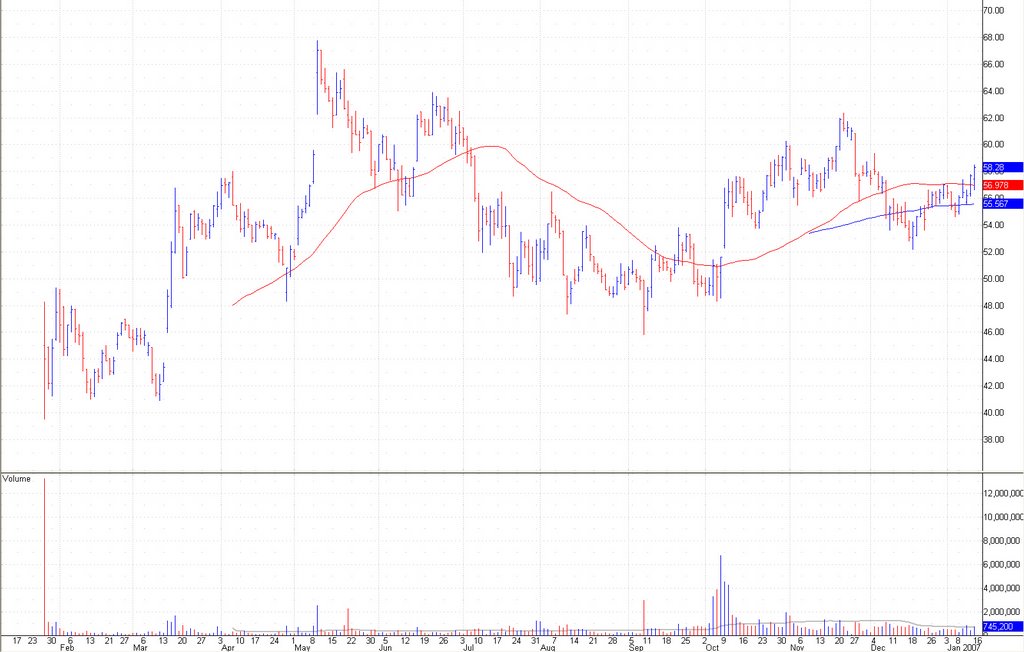
In the chart above, does a pattern emerge or become apparent that signals a directional trend? Or do the price bars appear of random occurrence?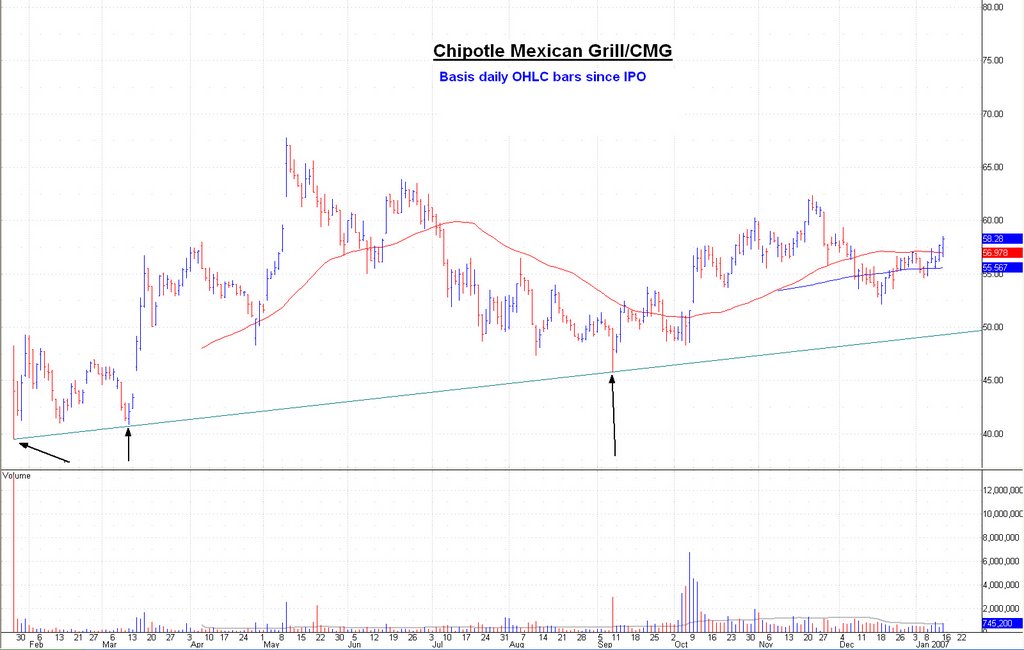
The trend line (as drawn in the chart above) captures the primary trend, which has been up since the IPO. It includes three tags (see arrows) that help validate, but not prove, the line of rising bottoms. (Gimlet-eyed readers will argue the drawn line contravenes the rules in my trend lines primer post -- that the line must capture each low prior to a subsequent higher high. They would be correct but for one crucial observation: I believe this pattern to be a base and the shares will soon achieve a higher high.)
Then I clone the major up trend line, and place it accordingly to delineate a trend channel. (See chart above.) Note that on this basis resistance lies at ~$75 (and rising). The longer the shares move sideways (base), the higher the price rise before it encounters resistance. The inflection points are the lower and upper channel lines. The objective is to purchase the shares on the lower line and sell the shares on or near the upper channel line. This is difficult for most investors because:
1) They mis-identify and draw incorrectly the lines;
2) Cannot pull the trigger when the moment is at hand.
Some investors achieve succes via purchasing breakouts within the channel...
... In the chart above, note trend line 1. It obeys the rules, in that its tags occur at each lower high prior to a subsequent lower low. Whereas many investors worried that this trend line would prove to be the new primary trend line -- direction: down -- I grew excited as it neared its primary up trend line during September 2006. Not surprisingly, once there, the shares bounced nicely. The bears were foiled yet again.
And then, upon release of its Q3 earnings report, the shares broke out above bearish trend line 1, and with massive volume! The fledgling decline was aborted precisely where it should be (the primary up trend line) and the shares subsequently staged a bullish price and volume breakout within the channel. And then, to top it all, the share price immediately staged a mini-decline to trend line 1, with a diminution of volume, and again held! Once resistance, now support. All in all, very bullish behavior.
Trend line 2 fails to follow the rules -- at least to date -- but is important nonetheless because it is the trend line most investors will draw and act upon. It offers two data points -- the all time high and the recovery high at $62.36 on 21 November. Two data points provide sufficient information to draw a line, albeit not necessarily the correct trend line. That trend line lies now at ~$61. These minor trend lines are sometimes known as fan formation lines. (Not part of this post.) Once above $61, the next real resistance will prove to be the all time high, but even that level will not stem the coming advance.
I ask again: Is the chart below (shown without its handful of trend lines) a base or top...?
It rewards the investor to take heed of directional trends. Traders represent a sizable constituency in the development of a chart pattern: the best traders obey rules -- pattern rules, money management rules, etc. As a result, price bars are rarely random and never meaningless; in fact, chart action is profoundly meaningful, if you learn how to read it. Please apprehend that within each major or primary trend channel occur trends of lesser primacy; these would be secondary and tertiary trends. These minor trends occur more frequently -- the whipsaw activity that confounds most investors. Many investors get their underwear in a twist over these short term oscillations of price; so close to the tree, they not only not see the forest, they also miss the bark. They see only the gnarls of the bark itself. Stand back to get the big picture.
With all that said, I was necessarily oblique in this post -- purposefully glossing over many rules to identify the correct data points, expectations from particular patterns and setups, etc to avoid unnecessary confusion. So I would think you have a question or two... Despite this admission, I wonder: Can you now see what I see? btw, you should not be surprised to learn I am a buyer of Chipotle Mexican Grill/CMG on each dip to support.
-- David M Gordon / The Deipnosophist
Labels: Market analyses
posted by David M Gordon | 12:42 AM
![]()
<< Home