


Trend Lines - A Primer
Rules: To identify correctly a down trend line, connect each lower high prior to a subsequent lower low. For an up trend, connect each higher low prior to a subsequent higher high. A trend line using any other data points is not correctly identified. (See example below.)
Questions: This comment, "the trend line of declining tops is important but not critical because it is incorrectly identified. It is, however, the trend line most amateur chartists would draw" resulted in two similar questions:
1) I am curious as to why you included it then, instead of identifying the correct trend line.
Example:

[click to enlarge]
Trend line 1 is the guilty party that sows confusion. The correctly identified trend line is #2 because it conforms to the rule: it captures each lower high prior to a subsequent lower low. (Note that other declining trend lines from the same starting data point - the all time high - could and would have been drawn.) Each trend line remains in force until the low trade is in place. Thus, line 1 is incorrectly identified because the low trade at B is higher than the low at A -- the decline appears complete. A new trend line should be sought; if not up, then at least sideways -- because the earlier trend (down) is complete.
At best, Line 1 is merely important, and certainly not critical. Why show it? Because it is, as mentioned in the original post, what most participants would draw (including Allan's software) as a trend line delineating the down trend. And *I* want to know what most participants will do, whether their efforts are correct or incorrect.
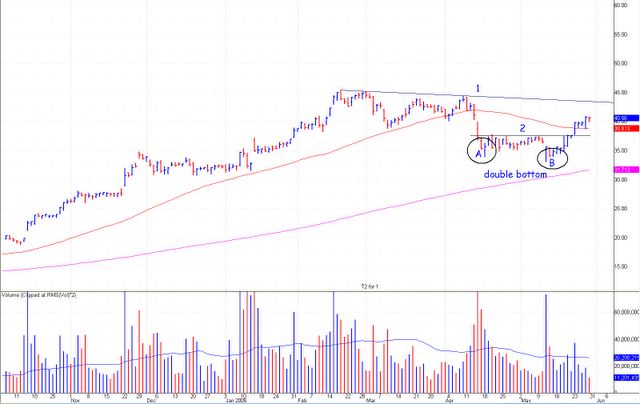
In Practice: Consider Apple Computer/AAPL -- On 11 May, AAPL effectively ended its down trend; the same day, I alerted readers of this blog that AAPL's reality had changed. By my reckoning, AAPL's decline was suddenly complete, and its new intermediate term base now builds... prefatory to fresh all time highs in the weeks and months ahead.
[click to enlarge]
Note that AAPL shares have yet to breach the correctly identified trend line of declining tops (1); nonetheless, the decline is complete. I have no need to wait for a breakout above ~$43.5 to confirm this reality, so my first purchase was $34.25 on 12 May, with many additional lots purchased since. (Thanks in part to your comments and questions, and other tidbits since accumulated - no less the the way the chart builds - I reassessed, and now perceive Apple Computer/AAPL as a long term investment.) Line 1 is critical, but so is Line 2, which confirms the double bottom, and the change in trend. AAPL is a particularly tricky pattern, which is why I show it. (Caveat: my perceptions rely on many more items than trend lines.) With the hard turn on 11 May, this correction becomes one more of time than price; someday - perhaps in coming days or weeks, perhaps in coming weeks or months - AAPL will break above Line 1, hurdle its all time high, and quickly run toward $60. And higher soon thereafter.
Of course, it is disheartening to see most market participants believe they know the rules, but in fact do not. The two roads to failure when investing:1) Incorrect analysis;
Should you ever come to learn and know the rules, then consistent success awaits you. Yes, this effort would require both personal diligence and time, but then it is your money; why not strive for success and excellence rather than be subject to the gales of fortune...?
2) Incorrect application of analysis - whether the analysis itself is correct or incorrect.
posted by David M Gordon | 10:27 AM
![]()
<< Home