Sudden volatility...
Note the sudden price volatility in the chart below (areas 1) with an explosion of volume (areas 2)...
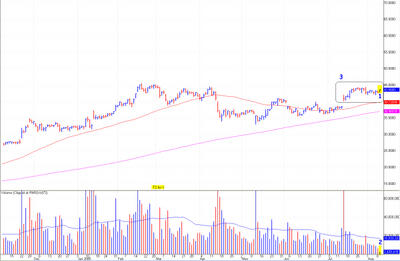
However, that volume, as expansive as it is on the 1 minute chart (above) lacks sufficiency even to appear on the daily chart (#2, in the chart below)...
[click to enlarge]
Area 3 is the small base necessary to accumulate sufficient strength to punch through critical triple resistance at ~$44.40. Area 1 is today's action so far. (Well, it was when I made this chart 20-30 minutes ago!) I note that, at this moment (~8am pdt), Apple/AAPL shares already have traded ~20% of average daily volume. It appears to me an upside breakout looms on the horizon. It is so near, in fact, that an investor no longer requires a telescope to get it within view.
Of course, my vision -- bad as it is -- has been quite alone. I wonder when the Apple/AAPL bears might capitulate? (Probably above $60. ;-)


<< Home