


Ray Fairfax on market leaders
Ray Fairfax offers his comments re market leaders...
~~~~~~~~~~~~~~~~~~~~~~~~~~
David,
I've been trying to figure out a way to help you get your message across about market leaders. This note represents my (inadequate) attempt to do so.
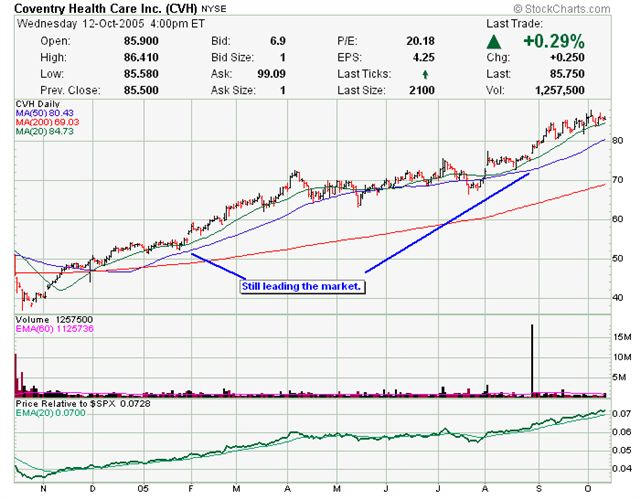
This chart represents, since IPO, what I believe to be the market leader of the past several years, Coventry Health Care/CVH.
 (Please ignore the rsi indicator on the Bigcharts long term chart. I thought I was getting "strength relative to spx" like on stockcharts.com.)
After topping in 1995, this stock takes a long big slide to it's ultimate low in Aug.1998. A runup to June of 1999 sets it up for the test of the bottom in the fall of 1999.
While the general market is in the throes of it's final upward blowoff, this stock has already done so and is declining. As the general market really gets going to the downside in the spring of 2000, this one has already bottomed and is on the way back up, breaking out on the upside cross (50, 200 day moving averages) in mid April 2000.

A several hundred percent run up from October 1999 to December 2000 sets it up for it's long CANSLIM base, culminating in the January 29, 2002 "breakout". Yeah, I know, the pivot point wasn't breached to the upside 'till several weeks later, but the volume spike on 1/29/02, in your words, spoke volumes. This stock appeared in the 1/29/02 "stocks in the news" charts in IBD. The charts therein are generated by Bill's proprietary CANSLIM computer model and often "break the rules" laid out in his book.
If you look carefully at the rest of the trading history of this stock you will see that it has consistently broken out ahead of the general market over the ensuing years, and still leads the way. And the IBD relative strength line has consistently moved to new highs before the stock did on each breakout.

Look at the big break in October 2004 that should have broken this chart but only served to re-set the base count.

To borrow a phrase that you like to use -- clear as mud?
-- Ray Fairfax
~~~~~~~~~~~~~~~~~~~~~~~~~~
David,
I've been trying to figure out a way to help you get your message across about market leaders. This note represents my (inadequate) attempt to do so.
This chart represents, since IPO, what I believe to be the market leader of the past several years, Coventry Health Care/CVH.
 (Please ignore the rsi indicator on the Bigcharts long term chart. I thought I was getting "strength relative to spx" like on stockcharts.com.)
After topping in 1995, this stock takes a long big slide to it's ultimate low in Aug.1998. A runup to June of 1999 sets it up for the test of the bottom in the fall of 1999.
While the general market is in the throes of it's final upward blowoff, this stock has already done so and is declining. As the general market really gets going to the downside in the spring of 2000, this one has already bottomed and is on the way back up, breaking out on the upside cross (50, 200 day moving averages) in mid April 2000.

A several hundred percent run up from October 1999 to December 2000 sets it up for it's long CANSLIM base, culminating in the January 29, 2002 "breakout". Yeah, I know, the pivot point wasn't breached to the upside 'till several weeks later, but the volume spike on 1/29/02, in your words, spoke volumes. This stock appeared in the 1/29/02 "stocks in the news" charts in IBD. The charts therein are generated by Bill's proprietary CANSLIM computer model and often "break the rules" laid out in his book.
If you look carefully at the rest of the trading history of this stock you will see that it has consistently broken out ahead of the general market over the ensuing years, and still leads the way. And the IBD relative strength line has consistently moved to new highs before the stock did on each breakout.

Look at the big break in October 2004 that should have broken this chart but only served to re-set the base count.
To borrow a phrase that you like to use -- clear as mud?
-- Ray Fairfax
posted by David M Gordon | 5:58 AM
![]()
<< Home