


Gold at $500 - a mild inflationary signal
Scott Grannis, Chief Economist at Western Asset Management...
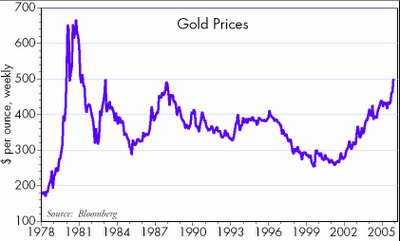
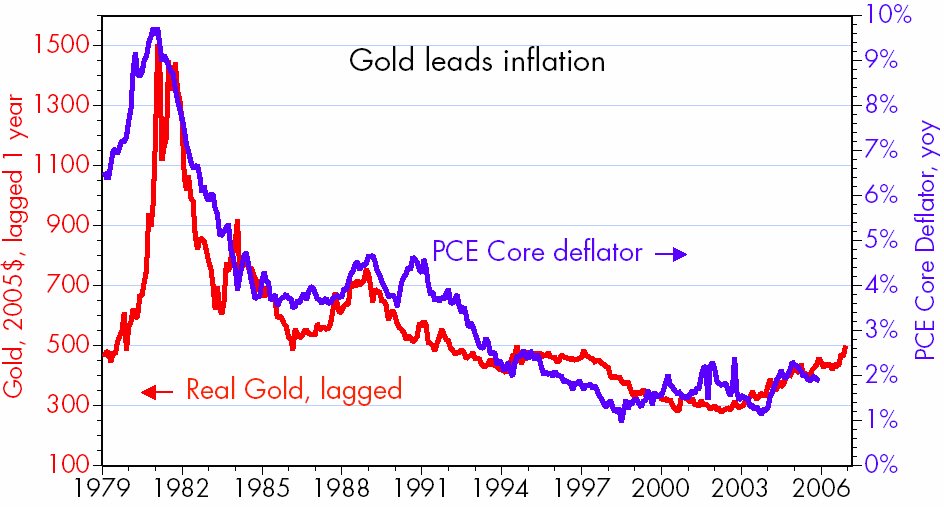
As the first chart (above) suggests, gold achieved a milestone of sorts yesterday with prices exceeding $500 per oz. It was only higher on a sustained basis in 1980, the year the CPI hit a high of 14.8%. But as the second chart shows, in inflation-adjusted terms (in this case I'm using the PCE core deflator) gold today is only modestly higher than it was 10 years ago, and only one-third as high as it was in January 1980. Simply put, $500 gold is not as scary today as it was in the past, thanks to the cumulative impact of inflation.
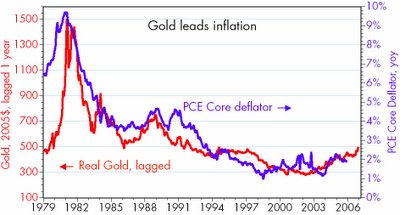
The second chart (above) also provides some quantitative support for the theory that gold is a good predictor of inflation. This theory (which is far from scientific, but is intuitive) holds that monetary imbalances show up first in the price of gold, then take awhile to work their way through to the general price level. If the Fed sets the funds rate at a level which is "too low," investors
a) sense that the purchasing power of the dollar may be at increased risk,
b) calculate that the odds of gold producing higher returns over time than their cost of borrowing are good, and therefore
c) seek refuge in gold,
d) borrow money (shorting the dollar) to buy gold,
e) are willing to pay higher prices for all tangible assets (e.g., golds, real estate, commodities) since they are likely to do better relative to the paltry real yield on financial assets that typically prevails in times of rising inflation, and
f) attempt to reduce their cash balances in favor of physical assets, thus increasing the velocity of money and supporting higher prices even in the absence of rapid money growth.
Conversely, if the Fed sets interest rates "too high," as it evidently did in the late 1990s, investors sell gold, sell commodities, buy dollars, increase cash balances, etc., and inflation declines.
If the second chart has any validity, it must of course be taken with a few grains of salt. Nevertheless, it does suggest that we are still in the presence of mild inflationary pressures, and that the core rate of inflation could drift up to 2.5% over the next year, a level somewhat above the Fed's 1-2% comfort zone. If the Fed were to return to a gold standard, this chart suggests that the Fed should target a gold price somewhere in the $300-400 range (in constant dollar terms) in order to achieve 1-2% inflation. Since a gold standard is highly unlikely, however, the next best thing, given that Bernanke is very likely to adopt a formal inflation target of 1-2%, would be to keep an eye on gold when deciding where the fed funds rate should be. After all, the Fed shouldn't wait for inflation to exceed its target before acting; it needs some method for predicting future inflation, and gold is as good as anything else out there.

As the first chart (above) suggests, gold achieved a milestone of sorts yesterday with prices exceeding $500 per oz. It was only higher on a sustained basis in 1980, the year the CPI hit a high of 14.8%. But as the second chart shows, in inflation-adjusted terms (in this case I'm using the PCE core deflator) gold today is only modestly higher than it was 10 years ago, and only one-third as high as it was in January 1980. Simply put, $500 gold is not as scary today as it was in the past, thanks to the cumulative impact of inflation.
The second chart (above) also provides some quantitative support for the theory that gold is a good predictor of inflation. This theory (which is far from scientific, but is intuitive) holds that monetary imbalances show up first in the price of gold, then take awhile to work their way through to the general price level. If the Fed sets the funds rate at a level which is "too low," investors
a) sense that the purchasing power of the dollar may be at increased risk,
b) calculate that the odds of gold producing higher returns over time than their cost of borrowing are good, and therefore
c) seek refuge in gold,
d) borrow money (shorting the dollar) to buy gold,
e) are willing to pay higher prices for all tangible assets (e.g., golds, real estate, commodities) since they are likely to do better relative to the paltry real yield on financial assets that typically prevails in times of rising inflation, and
f) attempt to reduce their cash balances in favor of physical assets, thus increasing the velocity of money and supporting higher prices even in the absence of rapid money growth.
Conversely, if the Fed sets interest rates "too high," as it evidently did in the late 1990s, investors sell gold, sell commodities, buy dollars, increase cash balances, etc., and inflation declines.
If the second chart has any validity, it must of course be taken with a few grains of salt. Nevertheless, it does suggest that we are still in the presence of mild inflationary pressures, and that the core rate of inflation could drift up to 2.5% over the next year, a level somewhat above the Fed's 1-2% comfort zone. If the Fed were to return to a gold standard, this chart suggests that the Fed should target a gold price somewhere in the $300-400 range (in constant dollar terms) in order to achieve 1-2% inflation. Since a gold standard is highly unlikely, however, the next best thing, given that Bernanke is very likely to adopt a formal inflation target of 1-2%, would be to keep an eye on gold when deciding where the fed funds rate should be. After all, the Fed shouldn't wait for inflation to exceed its target before acting; it needs some method for predicting future inflation, and gold is as good as anything else out there.
posted by David M Gordon | 8:42 PM
![]()
<< Home