Stretched on the rack
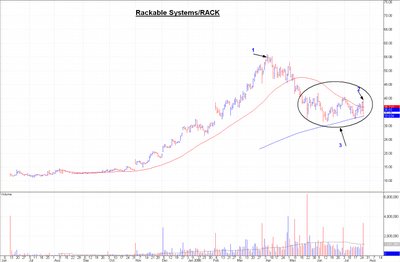
This is a pattern I formulated years ago alongside Steve Shobin; as he put it then, "When a flat to declining 50 day sma comes down to meet a flat to rising 200 day sma, close your eyes, hold your stomach, and buy the stock." This pattern does not work out all the time (it is of intermediate-term proportions), and there are subtleties; notably, that the pattern builds over ~6 months, or the disparity of time between the two moving averages.
Datapoint #1 is the all time high for RACK, set ~3 1/2 months ago. #2 is yesterday's ugly price reversal. Ugly, that is, until you place it in context: noise within the budding intermediate term base (#3). Note that, since the low trade of mid-June, the stock has built a very minor pattern of higher lows and lower highs; i.e., a symmetrical triangle.
At this specific moment, I have zero notion of how RACK will trade in the immediate future. I do know, however, that its future has itself become event-driven: Rackable Systems will report its earnings after the close tomorrow (Thursday). Subsequent to that report, the stock will break one way or another. A failure to hold at $34-32 despoils the bullish setup; contra, a breach above crucial resistance at $42 changes the dynamics materially. In fact, bullishly.
Will this post prove to be my final update re Rackable Systems/RACK? Only time will tell that tale; in fact, ~48 hours from now. I should add that while a breach of support at $34-32 would change my bullish interest in RACK based upon this setup, it is not necessarily reflective of changes at the company. As an investor, I rely on visual clues; when I seek a pattern, and that pattern builds, then I invest, and should the shares instead go opposite to my perception, as fortune would have it, I simply sell and move on. I no longer feel the need to be right, only to make money.
-- David M Gordon / The Deipnosophist


<< Home