In or out...?
Readers write, wondering whether I have re-purchased American Healthways/AMHC, and if yes, on what basis...
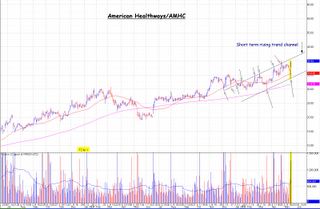
The answer is yes; AMHC is once again long in my portfolio. Although it did appear dicey for a brief while early-morning Monday, the shares held precisely where they ought. See chart below...
I had mentioned that AMHC likely has become the province of traders and speculators, thus it responds more to chart-based clues. The trend line of rising bottoms shows clearly why the shares reversed where they did. However, my objective with this post is not to teach the methodology for correctly identifying trend lines and channels, and especially not short term channels; all are too limiting in perspective and outlook. (The boundaries + most traders are too mechanical rather than intuitive.) So let us instead gaze upon this next chart...
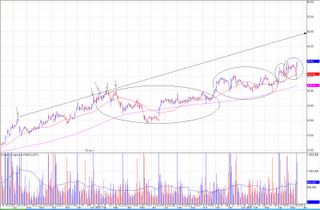
... which shows the stair-step progression in price from the southwest to northeast, the northeast quadrant (NWQ). Who knows how high is finally too high? The intermediate term channel line (of resistance) shows ~$50 as problematic; resistance is dependent upon when price tags that channel line. Dorsey Wright identifies a price objective of ~$55 based on its count. Perhaps AMHC will lollygag its way to $55 over the course of the coming three months, when that trend line and DW's objective intersect.
Who knows, indeed. I do know that Monday's high volume reversal is classic, and all but guarantees higher prices soon.


<< Home