


CPI and Federal revenues
Once again, Scott Grannis, Chief Economist at Western Asset Management...
~~~~~~~~~~~~~~~~~~~~~~~~~~~~~~~
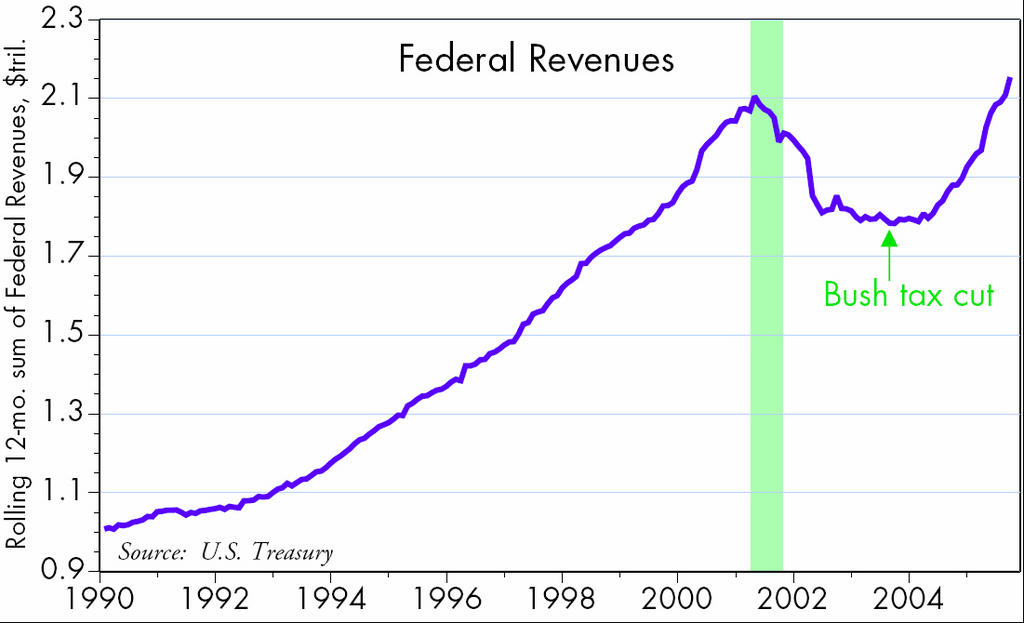
In the 2005 fiscal year just ended, federal revenues surged 14.6% from the prior year, exceeding forecasts by more than $100 billion. This ranks as the best year for the government's coffers since 1979. Spending rose at a much slower rate, 7.9%, but still faster than nominal GDP, which grew approximately 6%. As a result, the budget deficit fell from $411 billion last year to $317 billion this year, just 2.5% of GDP. A few years ago the deficit was projected to exceed 4% of GDP by this time, but stronger than expected economic growth and surging profits worked wonders to make things better. Many analysts have dismissed the strong revenue numbers this past year, arguing that they were a one-time result of big bonus payments late last year. However, the ongoing strength of revenues suggests there is substantially more activity going on out there than has been generally thought. It's also a great confirmation of the Laffer Curve: in this case, lower tax rates led to stronger growth, which in turn boosted revenue.

The CPI rose 1.2% in September, due mainly to soaring gasoline prices in the wake of the Gulf hurricanes, and is up 4.5% in the past year, the biggest annual rise since 1991. Ex-food and energy, the core CPI rose only 0.1% in September, and is up only 2.0% in the past year. Wholesale gasoline prices have recently fallen below pre-Katrina levels, so energy could subtract from the CPI this month. Still, it is likely that the CPI will finish the year with a rise of 4% or so, which will be substantially higher than the 2% increase in core inflation.
It's worth recalling that the rationale for excluding food and energy from any measure of inflation follows from the observation that those two items are unusually volatile on a month-to-month basis. Core measures of inflation are therefore less volatile than their headline counterparts and over short periods can give a better indication of underlying inflation trends. But to ignore energy after it has risen steadily for the past 3 years is a practice that needs to be called into question, even though the Fed has declared that the core PCE deflator is its preferred measure of inflation. Energy costs have indeed raised the cost of living, and not by an insignificant amount: the headline CPI index has increased 4.5% more than the core CPI in the past three years. There is no assuming this away, unless you are absolutely convinced that energy prices will return to the levels of three years ago, when oil was $30. If oil prices manage to hold at current levels, then the true measure of inflation will be the headline number, not the core number.
This raises another very important issue, since the Fed's focus seems to be on whether higher energy prices are feeding into other prices. The ongoing gap between core and headline inflation, and the fact that core inflation measures are hovering around a relatively low 2% level, would seem to suggest that they are not. Does it therefore follow that the Fed is doing a good job, and that the rise in energy prices simply represents a supply/demand imbalance in one sector of the economy and is not contributing to a rise in the overall price level? Not necessarily. If the Fed were tight, higher energy prices would force other prices to decline. When oil rose from $10 in late 1998 to $30 by late 2000, the headline CPI rose from 1.4% to 3.7% while the core CPI rose from 2.1% to 2.7%. Gold prices fell over that same period, however, and commodity prices were flat to down; real yields were exceptionally high, and the dollar rose against most currencies (meaning that the price of almost everything outside our borders, except oil, was falling). Ignoring energy back then was the right thing to do, because the balance of sensitive inflation indicators suggested that money was tight and higher oil prices were forcing other prices lower. Today, gold is rising, commodities are rising, real yields are low, and the best one can say about the dollar is that it has not fallen in the past year. This all suggests that the Fed is still accommodative and therefore higher energy prices are more likely today to find their way into the rest of the price level than they were a few years ago. Already we see anecdotal evidence of firms finding they have the ability to push through price increases.
There is another important issue these days which relates to how inflation is measured. Instead of using home prices and/or interest costs to measure the cost of housing, the BLS uses Owner's Equivalent Rent, which attempts to guess how much you would be paying in rent for the house that you currently live in. This constitutes 23% of the CPI, and was up only 0.1% in September, and only 2.25% in the past year, in stark contrast to the 14% average rise in housing prices across the country. The gap between home prices and rents has persisted for quite some time, but can be explained rather easily. Low interest rates, favorable tax treatment, and strong gains in income and wealth have fueled very strong demand for home purchases, with tthe result that there is a relative glut of homes for rent and a shortage of homes for sale, and this in turn has kept rents depressed relative to home prices. (Thus, paradoxically, the Fed's efforts to keep interest rates low in recent years have probably contributed to artificially suppress inflation.) (Interesting footnote: David Malpass notes that rising energy costs actually work to reduce owner's equivalent rent according to BLS methodology.) At some point this situation is likely to reverse, and when it does, we are likely to see housing contribute significant upward pressure to the CPI as the gap between rents and home prices narrows (e.g., rents are likely to rise as housing prices flatten or fall). This dynamic could offset most or all of any future decline in energy prices. Incidentally, using home prices rather than rents would have added about 2.5 percentage points to both the core and headline CPI in the past year, and that would put inflation substantially higher than the Fed's comfort zone.

My larger point here is that one's definition of inflation is critical, since two simple assumptions (to exclude food and energy, and to use rents instead of housing prices) can make a world of difference. As a bond market vigilante (one of an apparently vanishing breed, to judge by the 2.6% breakeven spreads on 10-year TIPS), I am loathe to give inflation the benefit of the doubt, especially when the Fed describes its own posture as still "accommodative."
Conclusion:
Inflation is a problem, and it's uncomfortably high.
~~~~~~~~~~~~~~~~~~~~~~~~~~~~~~~
In the 2005 fiscal year just ended, federal revenues surged 14.6% from the prior year, exceeding forecasts by more than $100 billion. This ranks as the best year for the government's coffers since 1979. Spending rose at a much slower rate, 7.9%, but still faster than nominal GDP, which grew approximately 6%. As a result, the budget deficit fell from $411 billion last year to $317 billion this year, just 2.5% of GDP. A few years ago the deficit was projected to exceed 4% of GDP by this time, but stronger than expected economic growth and surging profits worked wonders to make things better. Many analysts have dismissed the strong revenue numbers this past year, arguing that they were a one-time result of big bonus payments late last year. However, the ongoing strength of revenues suggests there is substantially more activity going on out there than has been generally thought. It's also a great confirmation of the Laffer Curve: in this case, lower tax rates led to stronger growth, which in turn boosted revenue.
The CPI rose 1.2% in September, due mainly to soaring gasoline prices in the wake of the Gulf hurricanes, and is up 4.5% in the past year, the biggest annual rise since 1991. Ex-food and energy, the core CPI rose only 0.1% in September, and is up only 2.0% in the past year. Wholesale gasoline prices have recently fallen below pre-Katrina levels, so energy could subtract from the CPI this month. Still, it is likely that the CPI will finish the year with a rise of 4% or so, which will be substantially higher than the 2% increase in core inflation.
It's worth recalling that the rationale for excluding food and energy from any measure of inflation follows from the observation that those two items are unusually volatile on a month-to-month basis. Core measures of inflation are therefore less volatile than their headline counterparts and over short periods can give a better indication of underlying inflation trends. But to ignore energy after it has risen steadily for the past 3 years is a practice that needs to be called into question, even though the Fed has declared that the core PCE deflator is its preferred measure of inflation. Energy costs have indeed raised the cost of living, and not by an insignificant amount: the headline CPI index has increased 4.5% more than the core CPI in the past three years. There is no assuming this away, unless you are absolutely convinced that energy prices will return to the levels of three years ago, when oil was $30. If oil prices manage to hold at current levels, then the true measure of inflation will be the headline number, not the core number.
This raises another very important issue, since the Fed's focus seems to be on whether higher energy prices are feeding into other prices. The ongoing gap between core and headline inflation, and the fact that core inflation measures are hovering around a relatively low 2% level, would seem to suggest that they are not. Does it therefore follow that the Fed is doing a good job, and that the rise in energy prices simply represents a supply/demand imbalance in one sector of the economy and is not contributing to a rise in the overall price level? Not necessarily. If the Fed were tight, higher energy prices would force other prices to decline. When oil rose from $10 in late 1998 to $30 by late 2000, the headline CPI rose from 1.4% to 3.7% while the core CPI rose from 2.1% to 2.7%. Gold prices fell over that same period, however, and commodity prices were flat to down; real yields were exceptionally high, and the dollar rose against most currencies (meaning that the price of almost everything outside our borders, except oil, was falling). Ignoring energy back then was the right thing to do, because the balance of sensitive inflation indicators suggested that money was tight and higher oil prices were forcing other prices lower. Today, gold is rising, commodities are rising, real yields are low, and the best one can say about the dollar is that it has not fallen in the past year. This all suggests that the Fed is still accommodative and therefore higher energy prices are more likely today to find their way into the rest of the price level than they were a few years ago. Already we see anecdotal evidence of firms finding they have the ability to push through price increases.
There is another important issue these days which relates to how inflation is measured. Instead of using home prices and/or interest costs to measure the cost of housing, the BLS uses Owner's Equivalent Rent, which attempts to guess how much you would be paying in rent for the house that you currently live in. This constitutes 23% of the CPI, and was up only 0.1% in September, and only 2.25% in the past year, in stark contrast to the 14% average rise in housing prices across the country. The gap between home prices and rents has persisted for quite some time, but can be explained rather easily. Low interest rates, favorable tax treatment, and strong gains in income and wealth have fueled very strong demand for home purchases, with tthe result that there is a relative glut of homes for rent and a shortage of homes for sale, and this in turn has kept rents depressed relative to home prices. (Thus, paradoxically, the Fed's efforts to keep interest rates low in recent years have probably contributed to artificially suppress inflation.) (Interesting footnote: David Malpass notes that rising energy costs actually work to reduce owner's equivalent rent according to BLS methodology.) At some point this situation is likely to reverse, and when it does, we are likely to see housing contribute significant upward pressure to the CPI as the gap between rents and home prices narrows (e.g., rents are likely to rise as housing prices flatten or fall). This dynamic could offset most or all of any future decline in energy prices. Incidentally, using home prices rather than rents would have added about 2.5 percentage points to both the core and headline CPI in the past year, and that would put inflation substantially higher than the Fed's comfort zone.

My larger point here is that one's definition of inflation is critical, since two simple assumptions (to exclude food and energy, and to use rents instead of housing prices) can make a world of difference. As a bond market vigilante (one of an apparently vanishing breed, to judge by the 2.6% breakeven spreads on 10-year TIPS), I am loathe to give inflation the benefit of the doubt, especially when the Fed describes its own posture as still "accommodative."
Conclusion:
Inflation is a problem, and it's uncomfortably high.
posted by David M Gordon | 12:57 AM
![]()
<< Home