


On a darkling plain
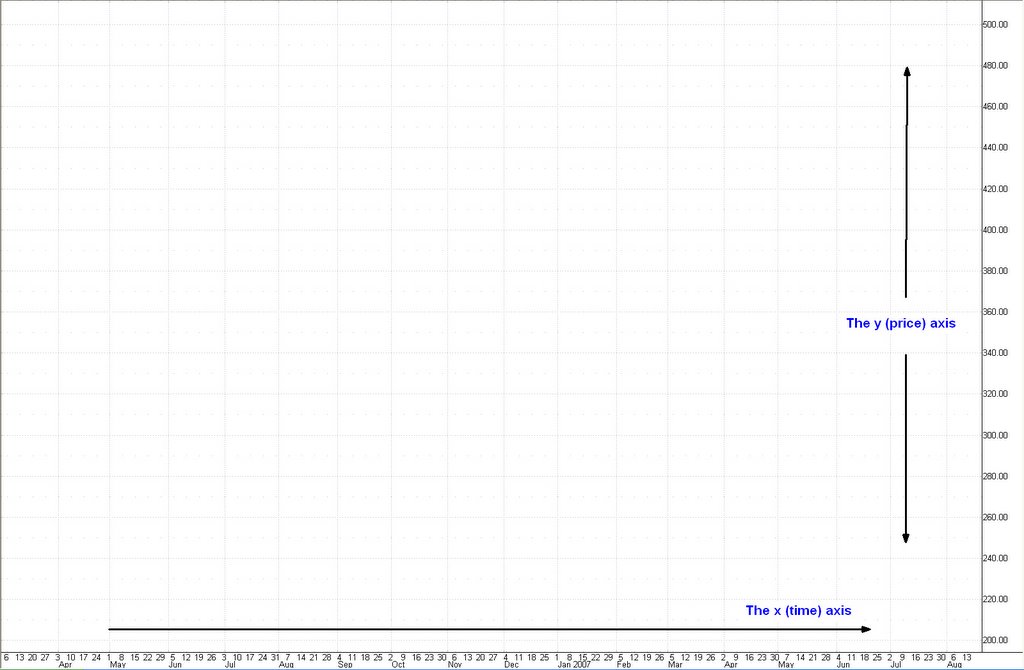
This of course is screamingly obvious. I find notable, however, that any inquiry about possible future chart action ("Should I buy or sell now?") focuses on price and rarely, if ever, inquires about time. This exclusion is to the viewer's detriment; each pattern fills from left to right (time) as much as it does from up to down (price). In fact, identified correctly, patterns from each axis can be as predictive as the other. So why not factor the y axis into your perceptions? Better yet, why not utilize concurrently both axes in your perceptions? You would end up with an apprehension of what I call the continuum...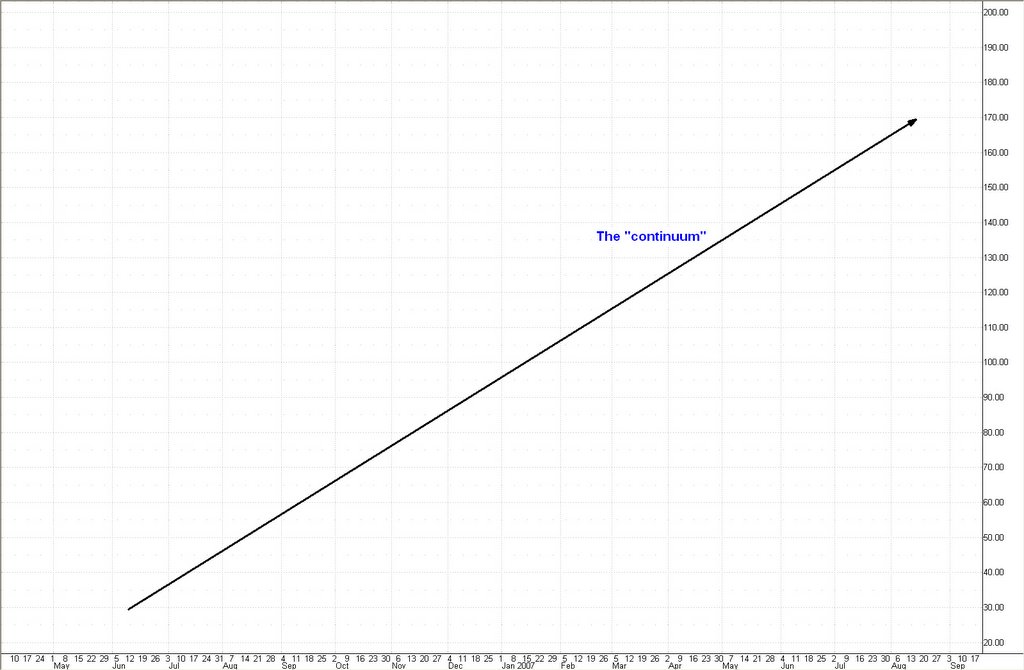 After learning and using all methodolgies of technical analysis, I deem critical four items: price, volume, pattern, and trend. (Secondary tools I rely on include moving averages, point & figure charts, etc.) Area patterns are the fill on the chart that help create the up or down trend (or continuum). The swings in price (trading range) could be large or small, and endure for a brief or lengthy period of time. For example, consider Corning/GLW...
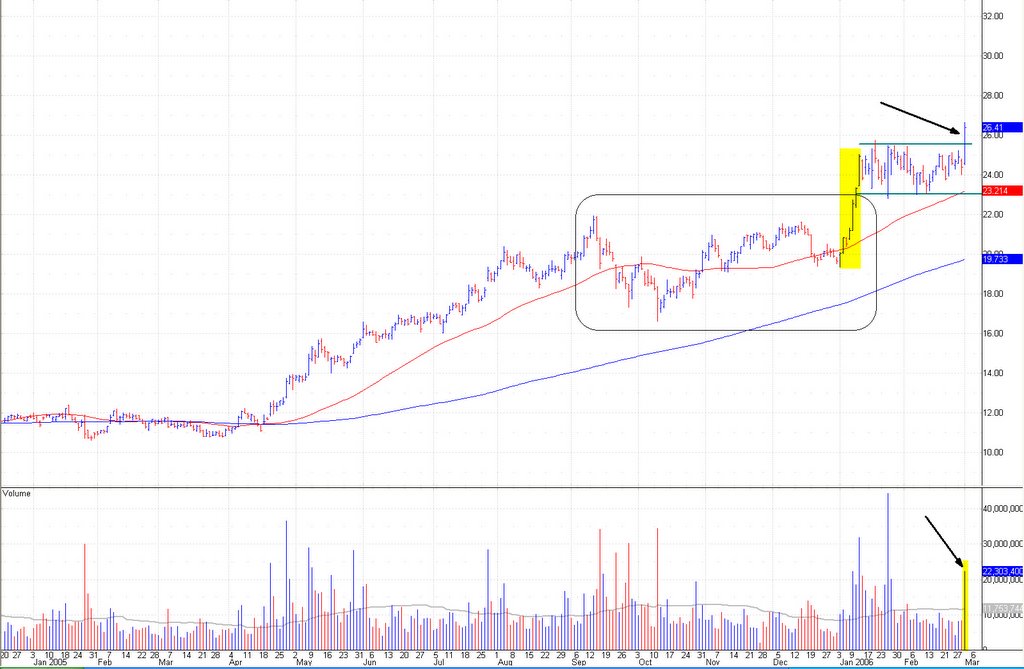
[click image to enlarge]
Readers of this blog will recall my recommendation from early January to purchase shares of Corning/GLW at $20. The rapid rise to $25.76 from $19.35 (highlighted in yellow) qualifies as the flagpole of a flag pattern. (I identify the flag's trend lines more for clarity of this discussion than for precision.) The "count" for this pattern is a rapid move upwards to ~$29-32. NB, however, and this is the important item, the extremely shallow nature of the ~6 weeks of flag, or its base building process. Identifying the long term trend (up), the explosive volume that occurs during upside breakouts, and the area pattern that fills the chart between the two axes results, for traders, in a lessened holding period via purchasing the moment of increased one-way price volatility. In this instance, up. I own shares at $25, $20, and $1.75 (as really long term readers might attest). GLW today broke out above the flag pattern. (Alas, before writing this post even though it was to be its featured topic.)
Or consider Garmin/GRMN, which I recommended for purchase in this post. Recall that the bigger the base, the more powerful the breakout; in this instance, a 5 month base sits atop an 8 month base. When GRMN does finally break out -- and it will; in fact, it is very near now to completion (perhaps as early as tomorrow) -- the move will be explosive in both price and volume. I own GRMN, and look forward with glee to its coming breakout.
Consider Teva Pharmaceutical/TEVA, another prior recommendation (most recently at $35 and $25)...
Today's upside "breakout" basically assures that this price decline will be shallow in price but lengthy in time, due largely to today's de minimis volume. Certainly, I have no problem buying and holding stocks whose chart patterns resemble this one; I prefer the base to broaden out in time so as to ensure an explosive upside breakout in price. The bigger the base (as measured in time, or x axis), the bigger the move. If you prefer to hold only during moments of extreme and one-way volatility, now would not be the moment to purchase; if, like me, you prefer to accumulate long term winners during patterns of intermediate term base building, now represents a good moment. Know, however, that short term volatility, in both directions, will return.
This recognition of price and time applies equally as well to opportunities such as NeuroMetrix/NURO and Joy Global/JOYG, each of which broke out today explosively (and were recommended previously). Each is a completely different pattern and setup, and also differ as to the placement within their continum. Who can forget the sudden caterwauling re Sirf Technology/SIRF in mid-January soon after I recommended its purchase? Faith required the investor to stay the course, despite the sudden bearish sentiment; the shares since have redeemed its pattern. On the hard, right edge of the chart are Apple/AAPL (quietly) and Google/GOOG (noisily; consider its seemingly wide, and increasingly obvious, trading range of ~$340 to ~$400), which build their new intermediate term patterns; whether base or top only time will tell. With the exception of "terminal shorts," however, no low is too low from which a recovery is possible. Just gaze again upon Corning/GLW, which declined to ~$1.50 from $113, and since has rallied to $27. A horrible bear market, yes; an astounding subsequent bull market, indeed.
There are many, many patterns that recur regularly, and are 'predictive'; they differ only as to shape, count, and placement within the lifecycle (the trend, or continuum). All true patterns, however, are replicable in all periodicities. Invest sufficient time to learn how a pattern builds, for how long it typically endures, and how many times it 'pings' each boundary of its trading range. Combine the two axes into a more complete apprehension of the chart action, and then time accordingly your purchases and sales. And thus achieve consistent investing success.
Of course, many readers know my personal motto, "Always wrong but never in doubt." With regard to investing, I never equivocate; buy, sell, or hold decisions always remain black & white. This means I am always wrong -- at least in some time frame. I consider consistent investing success to manifest as an increasing portfolio value due to, or in spite of, individual decisions to buy or sell this or that stock. Thus, these decisions are always either ephemerally correct or incorrect. Moreover, we each can scream hosannas to our 'stunningly prescient' specific buys or sells; I have found, however, that the more vocal an investor is, the less consistent his or her success.
Oh, and about this post's title... The line is from Matthew Arnold's poem, Dover Beach, and a recurring leitmotif in my life.
... Ah, love, let us be trueThe poem speaks to faith, something we each need in our life, and also require when investing... no matter the time frame. And what, precisely, does faith have to do with investing? I believe (hmmm) that the extent of an investor's time frame resolves about how much faith he or she has; i.e., holding positions overnight requires faith that he or she will do the right thing (make the hard decision) should matters come to a head. And that beyond the 'cloud of unknowing', the uncertain future, requires a type of faith that the company's product will be increasingly accepted, management will not bumble the opportunity, and the stock market will remain kindly disposed to the company's shares. Long term winner, Johnson & Johnson/JNJ could be the poster child for the faith required of investors. Who can forget in 1983 the sudden 50% share price decline as a result of the Tylenol-lacing incident? But management then did not bumble -- in fact, it proved exemplary -- and the shares quickly stabilized. And soon thereafter rose to new, all time highs, as we now know. Faith and (un)certainty, indeed.
To one another! for the world, which seems
To lie before us like a land of dreams,
So various, so beautiful, so new,
Hath really neither joy, nor love, nor light,
Nor certitude, nor peace, nor help for pain;
And we are here as on a darkling plain
Swept with confused alarms of struggle and flight,
Where ignorant armies clash by night.
As always, I welcome your questions, comments, and insights.
-- David M Gordon / The Deipnosophist
posted by David M Gordon | 12:01 AM
![]()
<< Home