


Base... or top?
 ... it is anything but a base; in fact, odds are excellent it is a top. (btw, the company name matters not at all for the purposes of this post.)
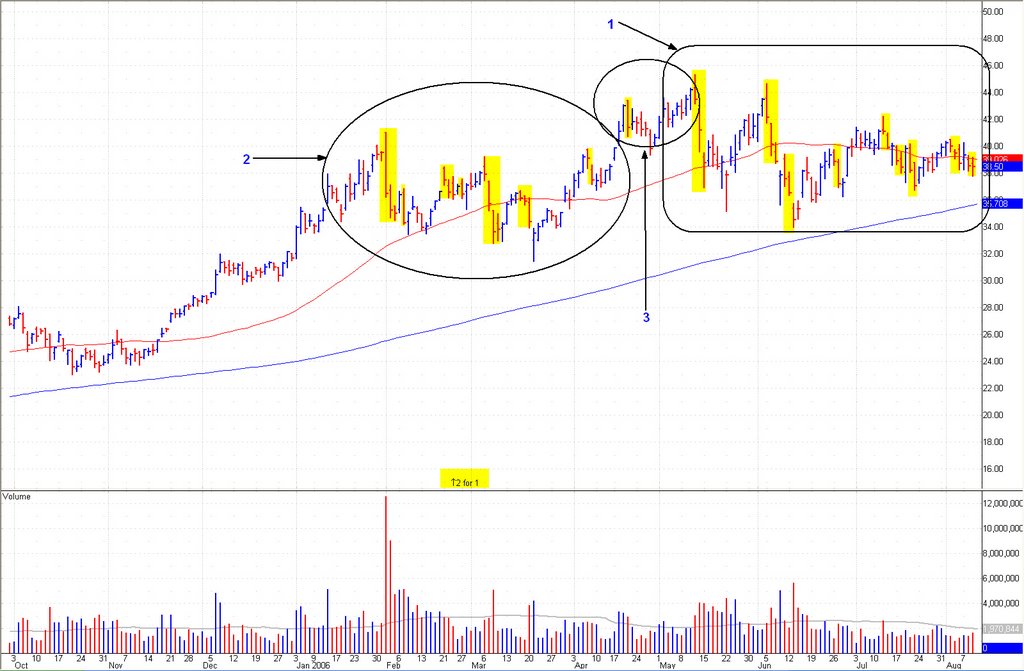 [click on each image to enlarge]
 NB the following subtle clues:
Area #1) The presumptive base...
Area #2) That follows the aborted prior base -- aborted by insufficient time, even though the share price went higher;
Area #3) The extraordinarily weak rally in price, accompanied by insufficient volume (price:volume relationship). That final rally proves so weak that it too quickly exhausted itself after only marginally higher highs and too few days of up trend.
#4) Note the abundance - nay, the preponderance - of reversal bars (highlighted) within the presumed base; way too many! In fact, the reversal bars populate this chart prior to the final push to new highs.
#5) Note the 2:1 split (highlighted) that follows 3:1 split (not shown, but just off the left margin). Share splits that occur too regularly, or greater than 3:1 are anecdotal evidence of an imminent end of prevailing trend.
#6) This particular stock has rallied to ~$45+ from ~$1.50 in ~5 years. Wow!
The market's leaders, even the strongest of the strong, require a breather every now & then, if for no better reason than to test the resolve of the bulls. It seems such will be the case soon for this company's stock. Lower prices ahead.
Questions?
-- David M Gordon / The Deipnosophist
posted by David M Gordon | 5:53 AM
![]()
<< Home