


I was wondering....
"The techs are in gear. [And yet] GOOG hasn't participated. Yesterday they announced a potentially very important alliance with Apple. But the stock didn't react at all. The moving averages are beginning to roll over (emphasis on BEGINNING). The volume characteristics don't look very good on the rally back from the gap resistance. The price/volume on the Weekly (chart) looks pretty sick. The RS (relative strength) keeps falling. On a purely technical basis, it doesn't look good to me. What do you think?"Yes, I see all that, and more. All very disturbing, to be sure. In fact, I have been warning throughout this year that 2006, and perhaps longer, would manifest on Google/GOOG's chart as inside bars on a long term chart. Most recently, for example, was this alert.
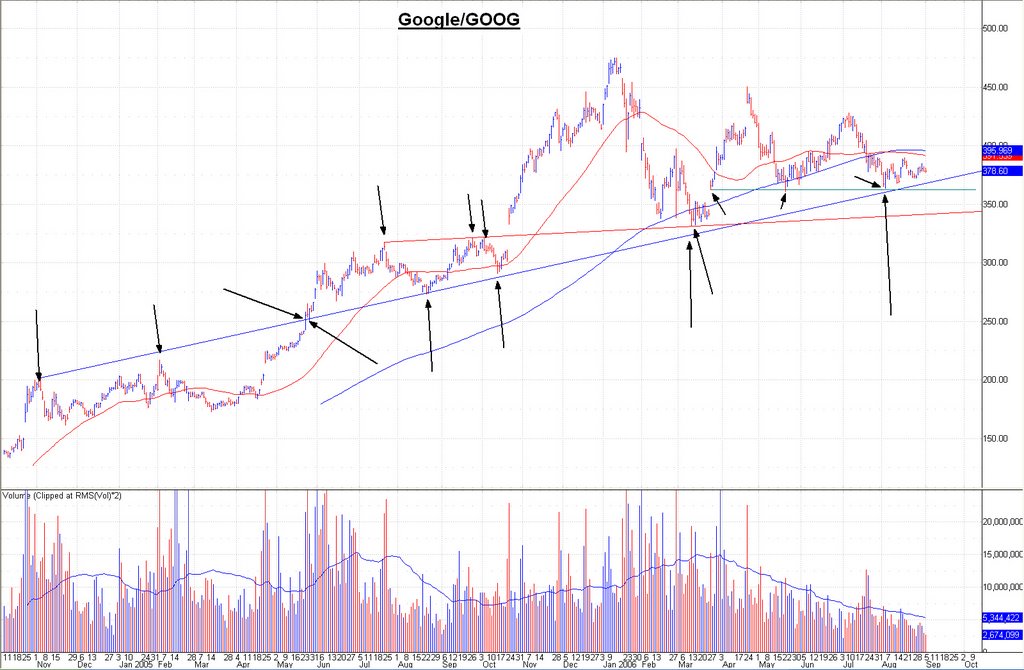
[click image to enlarge]
Delineated on the chart above, are three trend lines. The flat line (green) represents the short term trend and captures the oft-mentioned support at ~$360, which it has yet to breach. The intermediate term (past 1 year) trend line with the minor upside tilt (red) shows many specific data points of both support and resistance; it is a line that warrants attention. And the longer term trend line (blue) captures many data points of support and resistance as well; it also is the line that would be breached first, as its current placement (~$369) is immediately beneath recent prices. These lines could be broken, and the long term up trend would not change; that event would not occur until the price breaks beneath the long-argued ~$330. Until that event comes to pass, the shares remain in a high level consolidation, bounded by ~$450 on the high and ~$330 on the low. Traders will trade these two extremes.
Yes, I see the many area patterns in the daily, weekly, and monthly charts; many of which I previously have limned here. I could show them again, but when a stock is caught in a high level consolidation, as has been the case for Google/GOOG the past 8 months and counting, patterns, trend lines, and moving averages matter little. What does matter are fundamentals and valuation. So long as Google/GOOG's fundamentals continue to improve, its valuation too will improve as the stock tracks sideways. And then the sole remaining criterion is your conviction...
• Does the company remain a leader in its business, the economy, and the market?
• Do you believe, as I do, that Google/GOOG is more than a one-season wonder?
Look down; you stand before the hard, right edge of the chart. The future remains, as always, unknown and unknowable. Whoever said that being a long term investor is easy?
-- David M Gordon / The Deipnosphist
posted by David M Gordon | 6:25 AM
![]()
<< Home