


Johnson & Johnson/JNJ
Johnson & Johnson/JNJ reported this morning its Q2 (June) earnings of $0.93 per share, excluding items, $0.02 better than the Reuters Estimates consensus of $0.91; revenues rose 11.1% year/year to $12.76 bln vs the $12.62 bln consensus.
And the following analysis is from Dorsey Wright Analytics (published yesterday evening):
The Right Prescription for Your Portfolio: Johnson & Johnson/JNJ
In yesterday’s report, we discussed how some sectors have gotten a bit ahead of themselves, having recorded notable rallies over the past couple of months. More specifically, we had referred to how the Building and Oil, among others, had moved into overbought territory. This was evidenced by not only their member stocks’ ten-week trading bands, but weekly momentum readings (having been positive for numerous weeks), and their sector bullish percent readings (both BPBUIL and BPOIL are in the 81% area). This tends to suggest that these aforementioned groups may be ready for a “breather” of sorts.
That said, now is the time to look elsewhere for fresh ideas, to groups with better field position that aren’t as overbought. In other words, to groups that are showing signs of rotating into a full-blown growing season. Above we discuss one such sector that is worthy of your attention – Internet. Others that are showing promise include Biotech, Semiconductors, Electronics, to name a few.
Along these lines, we wanted to bring to your attention a name known to all – Johnson & Johnson [JNJ], the venerable Drug/Healthcare icon. This stock is, strictly speaking, a member of our Drug sector, although it obviously has ties to the Healthcare (Medical Products) sector. With respect to the Drug group, it is a sector whose bullish percent is in Bull Alert status at 50%, so the field position is still reasonable. The sector is still unfavored, yet both the PT and RSX charts for DRUG’s is close to reversing up into X’s. So we have been witnessing some subtle behind-the-scenes improvement.
JNJ has been the stalwart of the Drug sector for the past couple of years. While Merck and Pfizer were getting seriously injured (moving to new lows), JNJ was getting well-healed. In fact, JNJ hit a new all-time high of 69 in April after breaking out of a multi-year base. But as the market paused, so did JNJ. The stock pulled back from a straight spike up to 69, to the 64 area. This pullback in JNJ brought the stock back into an oversold condition, after having been overbought on its ten-week trading band.
In looking at the chart below, you can see how JNJ is now oversold. But what you can also clearly see is that JNJ is in the midst of a shakeout pattern on its .50 per box chart. As we have mentioned in the past, it can be helpful to lower the box size down when you have a situation such as JNJ that shows a straight spike up. By lowering the box size to .50, you get a much more informative technical picture of JNJ. With the shakeout pattern, the level to watch for is the first three box reversal back up; in the case of JNJ that would be at 65.50, as the chart points out. This would be the “buy” level for new positions. One of the attractive characteristics of such a pattern is that it typically provides for a palatable stop loss point – a break of the low during the shakeout (in the case of JNJ, that would currently be 63.50).

But besides the oversold condition of JNJ and its potential “Shakeout” pattern, there are other factors that are compelling about this stock. Most significantly is the fact that JNJ is a 5 for 5’er, meaning the stock is trading in an overall uptrend with excellent relative strength (both near term and longer term). That alone makes it worth consideration. But then when you look at JNJ compared to all other large cap pharma stocks, on a relative strength matrix basis, JNJ comes out on top, exhibiting the best long term RS. {This comparison used PFE, MRK, ABT, NVS, SGP, LLY, GSK, and WYE.}
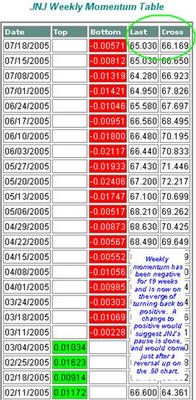
Secondly, JNJ has had negative weekly momentum for 19 weeks! Yep, 19 weeks – since March 11th. Needless to say, this is well beyond the average stay of 6 to 8 weeks. And this momentum reading is getting less and less negative, and literally is on the verge of turning back to positive. Such a change would be another sign that the pause in JNJ was done.
So when you add it all up, JNJ (which has a dividend yield of roughly 2%) is shaping up again. Therefore, as you look for new ideas in this market, JNJ is one to consider on the reversal up to 65.50. It may be just the right medicine for your portfolio.
And the following analysis is from Dorsey Wright Analytics (published yesterday evening):
The Right Prescription for Your Portfolio: Johnson & Johnson/JNJ
In yesterday’s report, we discussed how some sectors have gotten a bit ahead of themselves, having recorded notable rallies over the past couple of months. More specifically, we had referred to how the Building and Oil, among others, had moved into overbought territory. This was evidenced by not only their member stocks’ ten-week trading bands, but weekly momentum readings (having been positive for numerous weeks), and their sector bullish percent readings (both BPBUIL and BPOIL are in the 81% area). This tends to suggest that these aforementioned groups may be ready for a “breather” of sorts.
That said, now is the time to look elsewhere for fresh ideas, to groups with better field position that aren’t as overbought. In other words, to groups that are showing signs of rotating into a full-blown growing season. Above we discuss one such sector that is worthy of your attention – Internet. Others that are showing promise include Biotech, Semiconductors, Electronics, to name a few.
Along these lines, we wanted to bring to your attention a name known to all – Johnson & Johnson [JNJ], the venerable Drug/Healthcare icon. This stock is, strictly speaking, a member of our Drug sector, although it obviously has ties to the Healthcare (Medical Products) sector. With respect to the Drug group, it is a sector whose bullish percent is in Bull Alert status at 50%, so the field position is still reasonable. The sector is still unfavored, yet both the PT and RSX charts for DRUG’s is close to reversing up into X’s. So we have been witnessing some subtle behind-the-scenes improvement.
JNJ has been the stalwart of the Drug sector for the past couple of years. While Merck and Pfizer were getting seriously injured (moving to new lows), JNJ was getting well-healed. In fact, JNJ hit a new all-time high of 69 in April after breaking out of a multi-year base. But as the market paused, so did JNJ. The stock pulled back from a straight spike up to 69, to the 64 area. This pullback in JNJ brought the stock back into an oversold condition, after having been overbought on its ten-week trading band.
In looking at the chart below, you can see how JNJ is now oversold. But what you can also clearly see is that JNJ is in the midst of a shakeout pattern on its .50 per box chart. As we have mentioned in the past, it can be helpful to lower the box size down when you have a situation such as JNJ that shows a straight spike up. By lowering the box size to .50, you get a much more informative technical picture of JNJ. With the shakeout pattern, the level to watch for is the first three box reversal back up; in the case of JNJ that would be at 65.50, as the chart points out. This would be the “buy” level for new positions. One of the attractive characteristics of such a pattern is that it typically provides for a palatable stop loss point – a break of the low during the shakeout (in the case of JNJ, that would currently be 63.50).
But besides the oversold condition of JNJ and its potential “Shakeout” pattern, there are other factors that are compelling about this stock. Most significantly is the fact that JNJ is a 5 for 5’er, meaning the stock is trading in an overall uptrend with excellent relative strength (both near term and longer term). That alone makes it worth consideration. But then when you look at JNJ compared to all other large cap pharma stocks, on a relative strength matrix basis, JNJ comes out on top, exhibiting the best long term RS. {This comparison used PFE, MRK, ABT, NVS, SGP, LLY, GSK, and WYE.}
Secondly, JNJ has had negative weekly momentum for 19 weeks! Yep, 19 weeks – since March 11th. Needless to say, this is well beyond the average stay of 6 to 8 weeks. And this momentum reading is getting less and less negative, and literally is on the verge of turning back to positive. Such a change would be another sign that the pause in JNJ was done.
So when you add it all up, JNJ (which has a dividend yield of roughly 2%) is shaping up again. Therefore, as you look for new ideas in this market, JNJ is one to consider on the reversal up to 65.50. It may be just the right medicine for your portfolio.
posted by David M Gordon | 6:04 AM
![]()
<< Home