The core of the matter
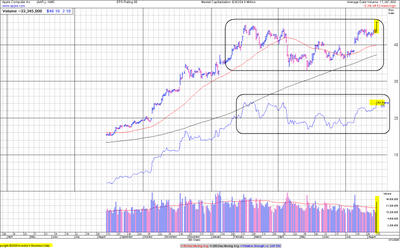
This chart has few annotations -- the better to keep a clear head and perspective. It shows "only" the near-ideal 6-month intermediate term base, and the high volume breakout from that base.
Oh yeah, and one more item. The relative strength line (not the RSI) preceded the price into new high ground. (Perhaps it is infinitesimally perceptible, but it is there.) Ray Fairfax and I previously illustrated this critical concept 4 months ago with Google/GOOG. That stock subsequently zoomed from ~$175 to ~$315.
Where, I wonder, have the Apple/AAPL bears suddenly gone to...?


<< Home