Early, on the downward slope
While at the gym yesterday, I had a conversation with a smart guy who also happens to be a professional investor. When he asked my thoughts re the market, I replied, "The market is very near cracking hard to the downside."
His reply was, "Everyone says that same thing."
I queried further, as my sources are universally bullish.
He explained that these same people had been bad-mouthing the market rally all the way up.
"Ahh," I said, as the light bulb over my head lighted. "Those investors probably rely on feel, and as such, the markets' many feints, diversions, and its meandering path to higher prices fooled them all the way up (if they bad-mouthed the rally all the way up)..."
It so happens that I too rely on feel. I mentioned previously that I see the necessary studies in my mind's eye, but there is a time and place for a mechanical interpretation, which is why I create the annotated charts I share here with you. I admit I have been light on the fundamental and valuation metrics of late while I attempt to show you how to discern true market action -- in particular in advance of its change. recall that, as investors, we express our interest in a company by buying its stock, not the company. (Yes, I acknowledge that in fact it is via the purchase of the company's shares.) It always is better to be in the wrong stock but at the right time than the right stock but at the wrong time.
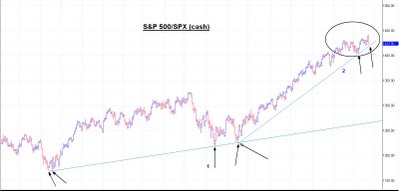
The past several weeks I have been warning that a large decline is setting up... Nay, nears completion of that set-up. I have no notion, at this moment, how deep the potential decline will prove to be, nor for how long it could endure; only that it is coming. Soon. Using the S&P 500 as the market proxy, and beginning at the end (sorry, I feel compelled to write that clause in that manner!), the S & P 500/SPX index appears set to decline to ~1325-1275, a 100 to 150 point decline from yesterday's closing price. From the recovery high, such a decline equals ~10% -- not particularly nasty, and to be expected within any up trend. Individual stocks will fare worse; they always do. The question becomes the ferocity of the initial decline; how fast will it decline --will it meander its way to lower prices, or have the aerodynamics of an anvil?

Based on the chart above, I expect a plummet that will begin soon; perhaps its first day was yesterday. On the chart, you can see quickly that I expect a decline to breach accelerated trend line #2, but to hold at primary up trend line 1. NB: the index has yet to breach anything, so this post is anticipatory. In addition to the primary up trend being old-in-the-tooth, the accelerated up trend rapidly loses up side momentum. In fact, the volatility that has occurred recently, and that has so confounded most market participants from obtaining a clear view of future directional trend, is itself a clue that the extant trend (in this instance, up) nears completion.
Do not wax overly bearish, however. I have shared the charts of many new leaders that quietly, almost secretly, lurk immediately beneath the breakout points from their massive, near decade-long, and profoundly bullish bases. Because each is so near their point of breakout, I would not buy any of them willy-nilly, but await the actual breakout. (You will recognize easily the moment.) Or, better yet, buy on or near each stock's primary up trend line. But that would be my methodology; I recognize buying on downside inflection points is not for most investors.
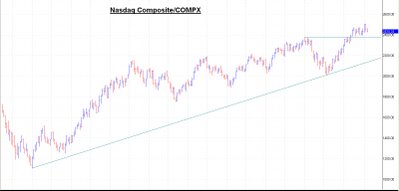
For the sake of being a completist, I include below the NASDAQ Composite index, which has an even more ominous picture...
 [click on each chart to enlarge]For the record, I detest posts of this type -- readers perceive them as predictions, whereas I intend them only as warnings of increased risk. And increased risk is what we, as investors, now face. For example, did anyone else other than me note the market's variant reception to Yahoo/YHOO's earnings report and its impact on the shares of Google/GOOG...? Previously, YHOO sold off on its report, and GOOG suffered sympathy pains, only to be redeemed by GOOG's report the following week. This week, YHOO initially rose, and GOOG exploded to the upside... before each failed yesterday. What does this change portend? The possibility that subsequent to Google/GOOG's earnings report next Thursday, its shares and YHOO's could decline. And possibly (probably?) lead lower the general market. I suspect GOOG's number will astound the Street for its profoundly bullish implications, but that it will suffer from the game of heightened expectations. If GOOG shares do decline, I expect initial support at $450-425.
This is why I pay no heed to 'predictions' re the general market's oscillations (yes, such as my warnings, including this one), and instead focus on the many and omni-present opportunities - where each lies within its continuum of probable risk and reward. Investing manifests as risk... but without risk there would be no reward.
And so it goes.
-- David M Gordon / The Deipnosophist
Labels: Market analyses


<< Home