


Shedding more light on the darkling plain
Basically, your "Darkling Plain" post is the best description of yours I've read yet to address the way you think about time. That's the good part, and why I complimented you on it. Yet it lacks what I'd call "the hard stuff" that would make it really actionable to readers who might want to rely upon it to pick stocks: Namely how to think about bases. Not ALL bases ultimately yield to breakouts. Some look like they're basing for a while and then break down, sometimes massively. And it's not as simple as saying, buy the low points in the base, and then if it breaks down you won't get hurt too badly. For we (or least most of us) have great difficulty analyzing where that low is. It might look like it's plateauing at a certain level only to ultimately establish a lower base later leaving one with substantial losses if they accumulate a large number of shares, and confronting the uncomfortable choice of holding and hoping for improvement or taking losses only to perhaps later see the shares recover and breakout.
As I've said to you before (I think you posted my last comments on this topic not too long ago) it is this that has so many people focusing on breakouts. They may offer less upside but they tend to be clear and unambiguous and good percentage of them go higher (at least in good market conditions). I know you've addressed such topics before in your newsletter and other places, but it's always remained opaque (not so much in theory as in practice.)
Perhaps with the added clarity and succinctness that your blog seems to have engendered you might try your hand at this topic again. Here are some topics to consider:
• What are the ways to recognize when a base is merely a resting period and not a prelude to a breakdown.
• How does one manage purchases to manage risk.
• How to know at what point in the base is the proper points to purchase.
• How to limit losses if wrong and how to recognize that you were wrong before getting hurt too bad.
Thank you for sharing your comments, Jiminy. Each of your assessments is correct... however, each also focuses on only one perception, the y axis (price). Why focus on solely the up & down movements of price to the exclusion of the left to right movement of time?
For example, consider Corning/GLW. Last Wednesday, it "broke out" (above $25) and quickly ran to $27.35. It dropped today as low as $25.47, a mere smidgen above its breakout. Please tell me: what happens next? The price breakout has occurred -- now what? Or consider Garmin/GRMN. It too broke out -- on its scheduled day, no less! -- to $76.70 from its breakout at ~$70. But today, the share price dipped all the way down to $72.50! Will today's low represent the low? How could it build a 5 month base, and then its upward move is so de minimis? (At least so far; in fact, the last base 'counts' to ~$85.) Here is one reason why: after any breakout, prices consolidate. That is, they run (up or down) only so far, and then hesitate and build an area pattern of some sort and of some duration. These patterns fill the chart, as explicated previously.
• Know how far these breakouts typically run in price before reversing (different percentage moves for NYSE vs NASDAQ stocks);
• Know how deeply in price the immediately subsequent counter-move will plumb;
• Know how long in time the immediately subsequent base will endure;
• Etc.
These bullet points add up to so much nonsense, especially the longer your investing time frame. In the end, technical analysis is both critical and folly. Garmin/GRMN built an 8 month base, broke out at $60, and then quickly rose to all of $70 ($10, or 15%) before building yet another base, this one of 5 months duration between $70 and $55. I would bet you believed (in this or a similar breakout) that the uptrend that ensued from such a nice base would carry higher in price and endure for more time than one or two weeks. So what help was that breakout? What certainty did it provide? What guarantee did it offer? How did it guide you? How do you (or even I) know that from $76.70, GRMN will not build yet another multi-months base?
In addition, bases occur in all trends, up, down, and sideways; what differs is time frame. In an up trend, for example, if a stock rallies in price to $30 from $20, and then trades sideways for several weeks between say, $26 and $30, isn't that too a base even though it transpires within an uptrend?
IF, however, you want to isolate and trade breakouts for the resulting one-way short term volatility only, then recognize that what you buy (or sell short) is volatility; neither trend nor time. In that instance, price, volume, patterns, and trend mean little except within the narrowest of intra-day periodicities. remember the role of faith in investing: the more faith an investor has, the less certainty he or she requires. And, in all likelihood, he or she grants a greater investing time frame.
There are, of course, subtle clues that provide at least one form of answer your questions; I have shared them here and will continue to do so. There is no one "proper point to enter purchases" because your time frame, risk tolerance, and objectives differ from his, hers... and mine. For example, one person is happy trading the $340-$400 range for Google/GOOG, whereas another investor patiently accumulates at $340 and another patiently awaits the breakout at $400 in the hope of adding a measure of certainty to the purchase.
But at what cost? Consider Qualcomm/QCOM in late-March 2000: after the sudden drop to ~$53 from $100 and several months of presumed basing, the shares "broke out" above ~$75 and 'ran' to ~$81.... before plummeting to under $50 (and lower). Tell me again of the 'certainty' that breakouts offer.
There are movements, patterns, setups of both price and time that speak to me; these patterns serve to encourage or caution. They are not infallible; nothing is. (And certainly not me.) One that I see often is what I term with the self-descriptive, "apostrophe" and "comma"; they appear precisely as they sound. The comma comes at the end of a long term down trend and an apostrophe at the tail end of a long term up trend. For example, is that an apostrophe in Apple/AAPL...?
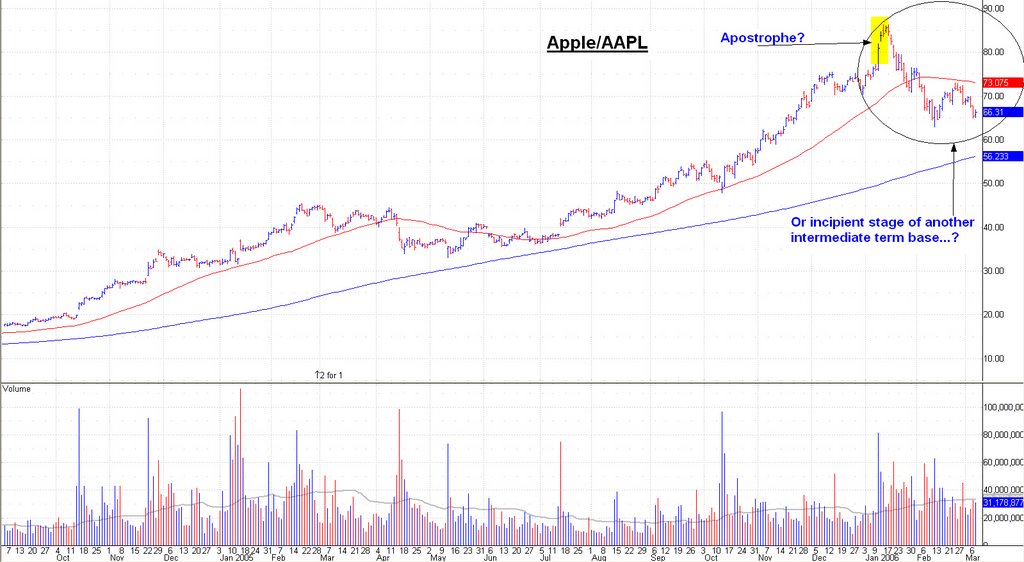 [click image to enlarge]
It sure appears that way to me. However, I prefer to retain a bullish perspective re this opportunity, so will continue to assume that the shares are busily building another intermediate term base with the low trade somewhere between $62-57. Obviously, that low has yet to be plumbed because this "decline" has been one more of time than price. At least, so far. As readers know, I sold Apple/AAPL at $85+; since then, I patiently bide my time awaiting the presumed low of the base when I will re-purchase. Or sufficient lapsed time, because both bases and tops do not require obvious price swings, as measured in amplitude.
I weave into a tapestry the separate threads of my expectation for the markets, specific stocks, and inter-market relationships. What I see for the intermediate term is not pretty. The market looks set(up) for a rocky (read, down in price) period (read, time; specifically several months with plenty of upside volatility in the short term). I have found that pretty, well-formed, picture-perfect bases do not in fact form in this type of expected market condition. So my portfolio becomes defensive; I prefer to miss the opportunity than to lose money. Investing is one half making money, one half not losing money. For example, presumed critical support for Google/GOOG (~$340) might not hold, so I sold recently (at $390) all lots purchased above $300. When it comes to Google/GOOG, call me a perma-bull if you prefer, but never a fool; I recognize risk when I see it.
Although at first glance it might seem I did not specifically respond to Jiminy's questions, I nonetheless believe the answers are included herein -- albeit in my typical round-about, logorrheic manner. If you remain unclear on any issue, PLEASE ASK.
-- David M Gordon / The Deipnosophist
posted by David M Gordon | 12:22 AM
![]()
<< Home