Google

The Deipnosophist

Where the science of investing becomes an art of living

My Photo
Name:
Location: Summerlin, Nevada, United States

A private investor for 20+ years, I manage private portfolios and write about investing. You can read my market musings on three different sites: 1) The Deipnosophist, dedicated to teaching the market's processes and mechanics; 2) Investment Poetry, a subscription site dedicated to real time investment recommendations; and 3) Seeking Alpha, a combination of the other two sites with a mix of reprints from this site and all-original content. See you here, there, or the other site!

30 June 2006

Fed ready to pause at 5.25%

The commentary below (after the line break) is by Scott Grannis, Chief Economist at Western Asset Management. Alas, once again it is sans charts and graphs. (The fault for this continuing problem lies directly with eBlogger. Please write that company, if this situation tires you as much as it does me.)
-- David M Gordon / The Deipnosophist
================================
Today the FOMC raised its funds rate target to 5.25%, marking its 17th consecutive decision to raise rates by 25 bps. More importantly, perhaps, the FOMC's statement suggested that this might be ready to pause: "The extent and timing of any additional firming that may be needed ... will depend on the evolution of the outlook for both inflation and economic growth...." Both the Fed and the market expect that economic growth is slowing enough, thanks to a softer housing market and the lagged effects of past rate hikes, to reduce lingering and somewhat elevated inflation pressures.

The bond market is still holding open the possibility of one more hike later this year, but with 2-year Treasury Note yields at 5.18% (implying that the funds rate will average only that over the next two years), the market is saying that the Fed is essentially done.

Whether that proves to be the case, however, will depend crucially on future data. Meanwhile, action in inflation-sensitive markets after the FOMC announcement suggested that inflation pressures will not likely be tamed by a 5.25% funds rate: the dollar fell, gold rose, and breakeven spreads widened. In other news the government revised upward the already record-breaking level of corporate profits in the first quarter, suggesting that the economy has quite a head of steam behind it. In short, while today's announcement might mark the arrival of the long-awaited Fed pause, it is also possible that the Fed could resume tightening at some later date.

29 June 2006

How to write good

These 22 examples of bad writing are mordantly clever; embedded within each is its inherent error. I know that I am especially (and frequently) guilty of #6. What about you -- any infelicities of language you care to 'fess up to...? (Oops, there I go again; suddenly guilty of #2!)

1. Avoid alliteration. Always.
2. Prepositions are not words to end sentences with.
3. Avoid cliches like the plague. (They're old hat.)
4. Employ the vernacular.
5. Eschew ampersands & abbreviations, etc.
6. Parenthetical remarks (however relevant) are unnecessary.
7. It is wrong to ever split an infinitive.
8. Contractions aren't necessary.
9. Foreign words and phrases are not apropos.
10. One should never generalize.
11. Eliminate quotations. As Ralph Waldo Emerson said, "I hate quotations. Tell me what you know."
12. Comparisons are as bad as cliches.
13. Don't be redundant; don't use more words than necessary; it's highly superfluous.
14. Be more or less specific.
15. Understatement is always best.
16. One-word sentences? Eliminate.
17. Analogies in writing are like feathers on a snake.
18. The passive voice is to be avoided.
19. Go around the barn at high noon to avoid colloquialisms.
20. Even if a mixed metaphor sings, it should be derailed.
21. Who needs rhetorical questions?
22. Exaggeration is a billion times worse than understatement.

26 June 2006

Incademy

This site appears to be of interest; at least upon first glance.
Incademy's aim is simple: to make you a better investor. Our courses are written by top financial journalists. They provide you with the facts, techniques and strategies that make the difference between ordinary and extraordinary performance.
What do you think -- does Incademy qualify for inclusion among the few sites I recommend over on the sidebar...?
-- David M Gordon / The Deipnosophist

25 June 2006

Thought for the weekend

Why Fool Around?

How smart is smart? thinks Heart. Is smart
what's in the brain or the size of the container?
What do I know about what I do not know?
Such thoughts soon send Heart back to school.
Metaphysics, biophysics, economics, and history-
Heart takes them all. His back develops a crick
from lugging fifty books. He stays in the library
till it shuts down at night. The purpose of life,
says a prof, is to expand your horizons. Another says
it's to shrink existence to manageable proportions.
In astronomy, Heart studies spots through a telescope.
In biology, he sees the same spots with a microscope.
Heart absorbs so much that his brain aches. No
ski weekends for him, no joining the bridge club.
Ideas are nuts to be cracked open, Heart thinks.
History's the story of snatch and grab, says a prof.
The record of mankind, says another, is a striving
for the light. But Heart is beginning to catch on:
If knowledge is noise to which meaning is given,
then the words used to label sundry facts are like
horns honking before a collision: more forewarning
than explanation. Then what meaning, asks Heart,
can be given to meaning? Life's a pearl, says a prof.
It's a grizzly bear, says another. Heart's conclusion
is that to define the world decreases its dimensions
while to name a thing creates a sense of possession.
Heart admires their intention but why fool around?
He picks up a pebble and states: The world is like
this rock. He puts it in his pocket for safe keeping.
Having settled at last the nature of learning, Heart
goes fishing. He leans back against an oak. The sun
toasts his feet. Heart feels the pebble in his pocket.
Its touch is like the comfort of money in the bank.
There are big ones to be caught, big ones to be eaten.
In morning light, trout swim within the tree's shadow.
Smart or stupid they circle the hook: their education.
-- Stephen Dobyns

Thoughts on the housing slowdown

The commentary below is from the estimable Scott Grannis, Chief Economist at Western Asset Management. It qualifies as essential weekend reading. (Alas, once again eBlogger does not support the uploading of image files, so the charts are MIA.)
-- David M Gordon / The Deipnosophist
=================================
(Begin Scott Grannis...)
All of the attached charts, coupled with just everything you see from Wall Street and in the press, suggest that the housing market is softening. Indeed, the peak in housing most likely occurred about 9 months ago. The prices of major home builder stocks are down 40% from last summer's peak. Inventories of unsold homes have skyrocketed 50% in the past year. A survey of major home builders reflects deteriorating conditions for only the third time in 20 years. 30-year fixed mortgage rates are up 140 bps from last summer's lows, and adjustable rates are up over 200 bps. Applications for new mortgages have fallen 25% in the past year, housing starts are down 10%, and an index of mortgage refinancing activity has plunged 80%. Housing price futures are now trading on the CME, and every one of the 9 contracts tied to major metropolitan housing markets shows prices declining.


Residential construction accounts for some 6% of GDP, mortgage equity withdrawal (MEW) has been estimated to be of similar magnitude, some $600-800 billion per year, and the value of private residences accounts for over one-third of households' $53.8 trillion net worth. Surely a downturn in construction activity, lower home prices, and a big drop in MEW has the potential to take a big bite out of the economy. Some estimates I have seen and that look reasonable suggest that a housing slowdown could subtract 1.5% from GDP growth, potentially resulting in an economy that grows only 2% instead of 3.5%. That would be enough to put the Fed on hold for an extended period, barring a further deterioration in the inflation outlook.


Not surprisingly, given the plethora of data already available, the majority of analysts, and even the Fed, expect that housing is already contributing to slow the growth of the economy. However, since it's no secret that housing is soft, the real surprise would be if the economy didn't slow down. Is that possible? I thought I would make the following observations, which don't receive nearly as much attention as the housing slowdown, if only to ensure that we aren't blindsided should the economy fail to weaken as expected.

Mortgage equity withdrawal does not create new demand. If I refinance my mortgage and take some equity out, and then spend some of that equity, my spending comes about at the expense of someone else's spending (i.e., the person who lent me the money for my new higher mortgage balance). I didn't work harder or produce anything new, I just spent some money that otherwise would have been spent by someone else. Also, it's important to note that mortgage equity withdrawal is not being financed by new money creation. Indeed, the M2 money supply is growing at only a very modest 4% pace these days, much less than the 7% growth in nominal demand. To be sure, MEW most likely results in more business for the Home Depots and furniture manufacturers of the world, but again that comes at the expense of spending in other areas. My friend David Gitlitz reminds me that less MEW might even be good for the economy, to the extent that money not spent by homeowners might end up being spent on things that are ultimately more productive than marble countertops and slate floors. In the end, however, since MEW doesn't represent productive activity, a reduction in MEW doesn't necessarily subtract from growth.
Nonresidential construction activity could offset a good portion of the slowdown in residential activity. Nonresidential construction accounts for about 11% of GDP, and its contribution to overall growth in the first quarter was 50% higher than it was last year, even as the contribution from residential construction fell by 50%. Corporate profits after tax are at an all-time high relative to GDP, so there is no shortage of funds available to finance the construction of new business-related structures. Indeed, businesses on average have not been investing or distributing their profits as fast as they have been collecting them, which is why the corporate sector has been deleveraging.
State and federal tax receipts are booming. Federal revenues alone are up at a 13% annual pace for the past two years. That is the fastest growth in real terms in recorded history. Booming revenues are coming from all sources: business profits, personal incomes, dividends, and capital gains, and the data through May don't show any signs of a slowdown. Where's there's smoke, there's fire: strong tax receipts imply lots of productive activity. It could be that other areas of the economy have already turned up by enough to offset the slowdown in housing.
Households are net beneficiaries of higher interest rates. According to my estimates, based off of the Federal Reserve's household balance sheet data, U.S. households as of March 2006 had over $8 trillion in floating rate assets (e.g., CDs and money market funds) and about $5 trillion of floating rate debt (e.g., ARMs and credit card balances). Higher interest rates thus increase households' net cash flow. It should also be noted that ARMs don't adjust immediately, and annual interest rate hikes are typically capped, so the pain that ARMs are going to cause will be spread out over the next several years and will only affect a minority of borrowers, since about two-thirds of all mortgages are fixed-rate. Of course, the logic of my first observation would suggest that if households are positively impacted by higher interest rates, then other sectors of the economy are negatively impacted, so the net result for the economy is something of a wash. But at least this highlights the difficulty and complexity of any attempt to extrapolate the impact of housing on the overall economy.
Households have not materially increased their leverage. For all the talk of MEW and the profligate ways of the U.S. consumer (as reflected in a record-breaking trade deficit), you would think that households had leveraged themselves to the hilt and that the economy was like a house of cards. Yet according to the Fed, the ratio of U.S. households' total financial obligations (debt service, auto lease payments, rents, homeowner's insurance, and property taxes) to disposable personal income increased from 17.7% in 1997 (when the current housing boom started) to 18.6% as of last December.

22 June 2006

Prosper.com

I received an interesting email today...

Hi David!

I've been poking around your site and thought you might be interested in checking out a company that I've been doing some consulting for… Prosper (
www.prosper.com), which is a people-to-people lending marketplace.

Prosper is kind of like an eBay for money except transactions aren't necessarily one-on-one. Lenders can diversify by bidding in $50+ increments across many loans with different quantitative characteristics (e.g., credit score based grades, debt to income ratios, etc.) as well as qualitative ones (e.g., personal stories and/or "group" affiliations).
Here are some listing examples.

While many people are lending on Prosper because they see it as a whole new asset class… you have your stocks, bonds, savings, and now a "Prosper portfolio"… others are really into the idea of helping out others while making a solid return. In case you're curious,
this link shows average funded borrowing rates, which roughly translate into corresponding rates of return for people who lend on Prosper.

If you have questions about Prosper or want to talk to talk to someone there, please let me know, I'd be happy to help connect you.


To which one reader says after viewing...
This loan site is interesting. It's similar to a concept that has long intrigued me - micro-lending (which works incredibly well in the third world). I have never thought it would work in the developed world where there are so many alternatives. The key question: Who are the borrowers and why would they borrow from there?
This is an interesting concept. But will it gain traction? Is it the right time? Is there a need for this market-place? What do you think?

-- David M Gordon / The Deipnosophist

Old Stars Don’t Lead New Bulls

This new post from Barry Ritholtz qualifies as more than interesting. And certainly worthy of your attention. It is complementary to my investing tenet to purchase leaders, always and only.
-- David M Gordon / The Deipnosophist

21 June 2006

Misoneism

Reader, Ray Seakan writes...

If my calculation is correct, RACK is selling for 38 times 2006 projected earnings. Its projected growth in EPS for 2007 is 29%. On this basis only, the stock seems fairly valued. Is it just the chart pattern which leads you to believe investors will pay higher prices for this stock? Or is there something else I am missing?
Your opening clause is the tail of the cat. "If... correct" pre-supposes the analysts are correct re their earnings estimates; too, I reject the fundmental measure you use as inherently flawed. It is akin to using BMI (body mass index) as some measure of a person's general well-being. An interesting number, but that is all it is.

I believe in the markets; that any one person could be smarter than anyone but is not smarter than everyone. I realize that for most investors this acceptance is problematical, but not for me. Please note the sequence of posts in this thread; read this post and also click back (via the embedded link) to the initiating post. The market initially called my attention to Rackable Systems/RACK by bidding higher its shares in a powerful and obvious up trend. But I waited for the market to grant me my opportunity to purchase at a low risk moment: a decline to $32-30 from the high of $56. That $32 area target was explicated from the get-go; I did not wait for the shares to decline, bounce, and then claim the price retrospectively.

So upon the achievement of my downside objective, I began to purchase the shares. Of course the stock could yet breach beneath this level, but I now have the position to manage and at a profit. Most investors sit on the sidelines awaiting some confirmation of a change in trend; certainty. Well, okay, that certainty would first occur with a breach and close above $36. Then would come the close above $37. And then $42. And so it goes; an ever higher price bringing with it its hand-maiden, higher levels of risk. Price = risk..

Your analysis carries with it a bearish cast -- what price should investors pay? Whereas mine has a bullish cast -- what price would investors be willing to pay? Each is correct; neither is incorrect. But I am a long-side, plain vanilla investor only, and not very smart to boot. The easier understood by me, the better. So, yes, chart patterns are important, but in the end meaningless. Too often, patterns in either direction bust before suddenly reversing in the originally perceived direction. This realization must be accepted and factored in to one's analysis. In advance of the subsequent action.

Meanwhile, I note RACK threatens its first breakout at $36, an interior trend line of declining tops. Should that occur, count it as the first obviously bullish brick in the wall. (The first bullish item was that its decline stopped dead in its tracks at $32, the pre-suggested price level.) I also note the very bullish action in Google/GOOG, despite the continued braying from the naysayers. And so it goes.

Questions? Comments?

-- David M Gordon / The Deipnosophist

16 June 2006

What's it to ya'?

Wow. And wow again.

Okay, Wednesday's profoundly bullish action was not immediately apparent to most investors. That is why you pay me the big bucks: to see market action in advance or even as it transpires. The action yesterday, however, should make the change in the markets' tenor more apparent to many investors. Of course, several quibbles exist; notably, the lack of volume. It rarely occurs that everything typically flows uni-directionally. But remember you possibly witness a market that slowly changes gears, changes directions.

The first real test of this rally occurs today, especially the latter half of the day and the close. What are the closing datapoints in relation to the day's total bar -- upper, middle, or lower third? Etc. Assuming a bullish day and close, the next crucial test would occur between today's close and next Tuesday's close. And so it goes. Can this rally be taken off weanling life support, and become a yearling?

So, okay, I have made a few lucky calls. But for all that, you should ask one question, "What good have those calls done for me, right or wrong?" And there you have it, the nub of the matter. Unless you trade options or futures on the market indices (not indexes!), predictions re the markets' direction in any time frame are useless. Your task, as investor, is to have always ready a list of investment opportunities.

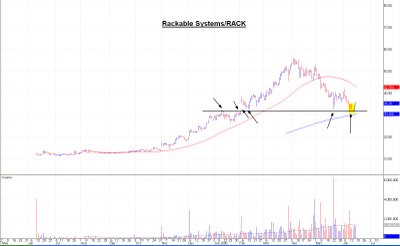
For example, I suggest repeatedly Rackable Systems/RACK. Yes, RACK looks good; it really does...

[click image to enlarge]

Note the line I have drawn. What once was resistance quickly reifies itself as now support thanks to the many tests and re-tests of the line. And now the 200-day sma (simple moving average) lies immediately beneath that line by ~5%. Purchases made at the oft-mentioned $32-30 price support would result in minimal losses in the event the stock breaks down beneath it. Does that not qualify as a professional investor's loss? Calculated in advance, managed by detail.

Before you invest, however, I suggest you wait, wait, and then wait some more; certainty, after all, is a highly-valued commodity. Wait until it becomes obvious the shares will not breach the 200-day sma. Wait until it becomes obvious the stock is not mired in a bear market, levitating before a ghastly and terminal plunge to $0/share. Wait until it has cleared all trend lines, not solely the declining trend lines. Wait until it breaches every obvious level of resistance. Complain about the volume at the most inappropriate moments in the gestation of the chart. A good price point to invest would be... hmm, let's see... ~$60/share. No, wait, better would be $80, even $100! The higher the price, the greater the certainty, the less the risk. Right...? Not!

Manage the details; manage the risk.
-- David M Gordon / The Deipnosophist

15 June 2006

Round and round and round...

Yesterday's market action comported itself quite bullishly; arguably the first bullish action I have witnessed in ~2 months. Yes, before the recovery highs, which were a bull trap, obvious even then.

The market had an opportunity to commit the bane of markets everywhere: open higher and close weaker, if not down, down, down. There was an attempt to plummet the market mid-day, but it regrouped and closed quite well. Was I one day too early for the incipient speed bump?

This latest attempt to rally itself might peter out, but then they all do in some time frame. The sole question is whether any rally fits your time frame. To me, every journey begins with a single step.

I find especially attractive the profoundly bulllish action in both Google/GOOG and Rackable Systems/RACK. As a market leader, Google/GOOG has led lower the market, but has since firmed up, establishing a pattern of higher lows within the greater context of a possible symmetrical triangle (see this pattern basis the weekly chart), while the market itself trades to lower lows. Rackable Systems/RACK continues to confound most investors; already I have read (elsewhere on the www) comments by purportedly savvy investors to stay away. These are the same people who told you to buy at $50+ but after earnings. Remember my write-ups: I suggested then (when the shares were in the 50s) that I sought a decline to $32-30, at which point I would begin buying. It gratifies me to witness the market still obeys chart patterns.

Each might yet fail, but read again the closing sentence of my third paragraph (above). No matter the number of times I state this, I cannot make myself understood. I do not seek the market to ratify my analysis; I take action upon the signals I identify in advance of subsequent market action. That RACK chooses to bounce from the pre-assigned support at $32-30 is no surprise; the sole item remaining is the sustainability of the low of the perceived pattern.

Alas, the ability to upload charts seemingly has been compromised.

-- David M Gordon / The Deipnosophist

14 June 2006

Hiding in Plain Sight, Google Seeks an Expansion of Power

As the race for Internet primacy quickens its pace, cheap, abundant, and readily available power (electricity) becomes a (the?) linchpin -- along with a plenitude of storage. Google/GOOG is so far ahead in this arms race that its competitors gasp for oxygen in their quixotic bid to maintain a third place finish. It seems increasingly apparent they should forget about the attempt to catch up.

"On the banks of the windswept Columbia River, Google is working on a secret weapon in its quest to dominate the next generation of Internet computing."

Well, it might be a secret to many people, but not for readers of this blog. I shared here months ago this very "secret"!

-- David M Gordon / The Deipnosophist

New York Times

June 14, 2006
Hiding in Plain Sight, Google Seeks an Expansion of Power
By JOHN MARKOFF and SAUL HANSELL

THE DALLES, Ore., June 8 — On the banks of the windswept Columbia River, Google is working on a secret weapon in its quest to dominate the next generation of Internet computing. But it is hard to keep a secret when it is a computing center as big as two football fields, with twin cooling plants protruding four stories into the sky.


The complex, sprawling like an information-age factory, heralds a substantial expansion of a worldwide computing network handling billions of search queries a day and a growing repertory of other Internet services.

And odd as it may seem, the barren desert land surrounding the Columbia along the Oregon-Washington border — at the intersection of cheap electricity and readily accessible data networking — is the backdrop for a multibillion-dollar face-off among Google,
Microsoft and Yahoo that will determine dominance in the online world in the years ahead.

Microsoft and Yahoo have announced that they are building big data centers upstream in Wenatchee and Quincy, Wash., 130 miles to the north. But it is a race in which they are playing catch-up. Google remains far ahead in the global data-center race, and the scale of its complex here is evidence of its extraordinary ambition.

Even before the Oregon center comes online, Google has lashed together a global network of computers — known in the industry as the Googleplex — that is a singular achievement. "Google has constructed the biggest computer in the world, and it's a hidden asset," said Danny Hillis, a supercomputing pioneer and a founder of Applied Minds, a technology consulting firm, referring to the Googleplex.

The design and even the nature of the Google center in this industrial and agricultural outpost 80 miles east of Portland has been a closely guarded corporate secret. "Companies are historically sensitive about where their operational infrastructure is," acknowledged Urs Holzle, Google's senior vice president for operations.

Behind the curtain of secrecy, the two buildings here — and a third that Google has a permit to build — will probably house tens of thousands of inexpensive processors and disks, held together with Velcro tape in a Google practice that makes for easy swapping of components. The cooling plants are essential because of the searing heat produced by so much computing power.

The complex will tap into the region's large surplus of fiber optic networking, a legacy of the dot-com boom.

The fact that Google is behind the data center, referred to locally as Project 02, has been reported in the local press. But many officials in The Dalles, including the city attorney and the city manager, said they could not comment on the project because they signed confidentiality agreements with Google last year.

"No one says the 'G' word," said Diane Sherwood, executive director of the Port of Klickitat, Wash., directly across the river from The Dalles, who is not bound by such agreements. "It's a little bit like He-Who-Must-Not-Be-Named in Harry Potter."

Local residents are at once enthusiastic and puzzled about their affluent but secretive new neighbor, a successor to the aluminum manufacturers that once came seeking the cheap power that flows from the dams holding back the powerful Columbia. The project has created hundreds of construction jobs, caused local real estate prices to jump 40 percent and is expected to create 60 to 200 permanent jobs in a town of 12,000 people when the center opens later this year.

"We're trying to organize our chamber ambassadors to have a ribbon-cutting ceremony, and they're trying to keep us all away," said Susan Huntington, executive director of The Dalles Area Chamber of Commerce. "Our two cultures aren't matching very well."

Culture clashes may be an inevitable byproduct of the urgency with which the search engine war is being waged.

Google, Microsoft and Yahoo are spending vast sums of capital to build out their computing capabilities to run both search engines and a variety of Web services that encompass e-mail, video and music downloads and online commerce.

Microsoft stunned analysts last quarter when it announced that it would spend an unanticipated $2 billion next year, much of it in an effort to catch up with Google. Google said its own capital expenditures would run to at least $1.5 billion. Its center here, whose cost is undisclosed, shows what that money is meant to buy.

Google is known to the world as a search engine, but in many ways it is foremost an effort to build a network of supercomputers, using the latest academic research, that can process more data — faster and cheaper — than its rivals.

"Google wants to raise the barriers to entry by competitors by making the baseline service very expensive," said Brian Reid, a former Google executive who is now director of engineering at the Internet Systems Consortium in Redwood City, Calif.

The rate at which the Google computing system has grown is as remarkable as its size. In March 2001, when the company was serving about 70 million Web pages daily, it had 8,000 computers, according to a Microsoft researcher granted anonymity to talk about a detailed tour he was given at one of Google's Silicon Valley computing centers. By 2003 the number had grown to 100,000.

Today even the closest Google watchers have lost precise count of how big the system is. The best guess is that Google now has more than 450,000 servers spread over at least 25 locations around the world. The company has major operations in Ireland, and a big computing center has recently been completed in Atlanta. Connecting these centers is a high-capacity fiber optic network that the company has assembled over the last few years.

Google has found that for search engines, every millisecond longer it takes to give users their results leads to lower satisfaction. So the speed of light ends up being a constraint, and the company wants to put significant processing power close to all of its users.

Microsoft's Internet computing effort is currently based on 200,000 servers, and the company expects that number to grow to 800,000 by 2011 under its most aggressive forecast, according to a company document.

Computer scientists and computer networking experts caution that it is impossible to compare the two companies' efforts directly. Yet it is the way in which Google has built its globally distributed network that illustrates the daunting task of its competitors in catching up.

"Google is like the Borg," said Milo Medin, a computer networking expert who was a founder of the 1990's online service @Home, referring to the robotic species on "Star Trek" that was forcibly assembled from millions of species and computer components. "I know of no other carrier or enterprise that distributes applications on top of their computing resource as effectively as Google."

Google's inclination to secrecy began in its days as a private company in an effort to keep its rivals from determining the profits it was making from Web search advertising. But its culture of secrecy has grown to pervade virtually all of its dealings with the news media and even its business partners.

In the end, of course, corporate secrets have a short shelf life in a search engine age. Entering "Dalles Google" as a Google query turns up plenty of revealing results. But Google Earth, the satellite mapping service, like its rivals, so far shows the 30-acre parcel here quite undeveloped.

13 June 2006

Down the drain

"...this decline appears set to worsen before it improves."

I stated the above in "Bowel Movements" but said much the same thing in "Circling the drain" -- each an update of my recommendations from early-May to retreat in haste. Even the "budding setup" was steamrolled by this market decline. This is about as ugly as it gets in the way of setups, but not as low as the decline itself will probe. For example, the SnP 500, now ~1225, could probe 1000. Ouch.

All the former leaders -- oil, metals (inc gold, silver, and uranium), late-cyclicals, etc -- are especially taking it on the chin. What a knock-out blow has been dealt them! But as I warned in early-May, the decline for these groups and the market is not "sudden"; it was telegraphed by the subtle clues, even as the market "broke out" to recovery highs.

So the attempt to build a speed bump to slow this market's descent has failed. What does it tell you when a market is worse than you feared? What does it tell you when markets around the globe plummet in unison? Just how low is low?

Continue to be wary of the market's many upside feints, as warned. Or as I stated previously, do not allow the market to sucker you in, or instead be sucker-punched by the market.
-- David M Gordon / The Deipnosophist

12 June 2006

The budding setup...

... of the charts of the market's averages and indices refects the possibility for a more stable market during the coming days and weeks (short to intermediate term), as a means to "fill the chart" (pattern). However, unless the price levels rebound to levels sufficiently high to break their more ominous pall (intermediate to long term; say, to September/October), then short term strength would likely prove a good opportunity to sell. Hmm, a trader's market.

I note the reflexive strength in the US$, which now butts its head against critical resistance (~87). This is a crucial change for the better in the intermarket backdrop, but how it fends from here (near resistance) likely will tell the tale of the tape. Because gold and the mining stocks trade largely contra to the primary trend of the US$, watch for a petering out of the strength of the $ before committing new funds to that sector. This means that a successful upside breach of the 87 resistance area would hurt grievously the chances for the gold stocks to break out of their recent doldrums (one way ticket down down down).

If you want to trade the possible and potential upside the markets might execute in the short term, look among those stocks that have been:

1) Battered the most, and
2) Held up the best (relative strength)
over the course of the past 5-6 weeks. Please share your candidates as a reply to this post. I would like to know those opportunities that look good to you.

Trade well,

-- David M Gordon / The Deipnosophist

10 June 2006

Thought for the day

As only my good buddy, Billy Shakespeare, could express it...

When to the sessions of sweet silent thought
I summon up remembrance of things past,
I sigh the lack of many a thing I sought,
And with old woes new wail my dear time's waste.
Then can I drown an eye, unused to flow,
For precious friends hid in death's dateless night,
And weep afresh love's long since cancelled woe,
And moan th' expense of many a vanished sight.
Then can I grieve at grievances foregone,
And heavily from woe to woe tell o'er
The sad account of fore-bemoanèd moan,
Which I new pay as if not paid before.
But if the while I think on thee, dear friend,
All losses are restored and sorrows end.

09 June 2006

Well, how about THAT?

Yesterday's rally, although expected (see post below), was nonetheless impressive.

All the market averages succumbed early-on to exaggerated weakness; it was a give-away. The rally from the intra-day lows came on a good increase in volume; always desired. Apart from the price swings is there any discernible change in the backdrop? Yes, and the most obvious of those is a slight turn up and for the better in the US$; I believe this strength is crucial for positive market conditions in this environment. The price swing does not have far to traverse, however, before it encounters significant resistance (~86.5-87).

Despite the swing up, the charts of the market averages still have an ominous cast: simple peak & trough analysis finds a discernible pattern of lower highs and lower lows. A quick & dirty time count could be appropriate here, so let's use the 2½ unit rule: this rally must sustain itself for in excess of the next 2½ days to factor as meaningful. I suspect that between now and Tuesday's close the market will again turn down. (The reversal could occur as early as this afternoon.) The question then would become, "Will yesterday's lows hold?" On a price level basis, the SnP 500/SPX could rally ~10 points more from yesterday's close (to ~1270) before encountering resistance. This all might seem confusing at first blush, so allow me to state it differently: the strength of any trend is not the one obvious to all but its tests of the trend and the tests of those tests. That is, if yesterday's low represents the low of the decline, then a bottoming process must ensue from that point, which denotes additional declines to the lows that hold at what is now support.

Still confusing? Consider this: during a market sell-off akin to what has transpired over the past 5-6 weeks, the professional trader scans first for two type of patterns -- those that have sold off the most (horrific price declines) and those that have sold off the least (held up well on both an absolute and relative basis.) Several charts might show this better...

The NASDAQ...

Apple Computer/AAPL...

Google/GOOG...

(charts and additional commentary to follow; no uploading capability all morning -- dmg)
But all this chart analysis is meaningless when it comes to money (portfolio) management; different principles rule there than making silly predictions. For example, Trader Dan phoned me yesterday. He wanted my read of the chart of Johnson Controls/JCI. It seems he has a client who inherited the position, and has now owned it for years. All I could say was, "Wow, bully for him!" But should he (the client) write covered call options? Did I think the stock had exhausted its primary uptrend that has endured for several years? Those are not the questions to be asked, as *I* perceive the issue. Yes, the shares might have peaked, but in what time frame? He (the client) has managed to hold the shares through all the other seemingly (at the time) disastrous reversals. In fact, the market now pays him to diversify -- to create his own diversified portfolio using JCI as a source of funds. For example, for each 100 shares of JCI he sells, he could purchase 1,250 shares of Ford/F. Now we all know about the problems Ford struggles to get past -- they make for a compelling case to avoid the stock -- but still I could build a bullish argument. However, that is not my purpose here; now I merely point out that the two stocks are literally (and very obviously) the mirror image of the other. If you believe that stocks ultimately regress to the mean, then selling one and purchasing the other in a ratio of 12.5:1 qualifies not only as sound portfolio management but creates the investor's own hedge fund -- with the hedge being diversification. Yes, Ford/F might go belly-up, but F would not be the sole new purchase, of course. (BTW, if you do not like Ford/F, there exist many other stocks whose charts are the mirror image of JCI's.)

Finding investment opportunities come in many guises, and make investing fun.
-- David M Gordon / The Deipnosophist

08 June 2006

Bowel movements, aka stomach-churning declines

I posted this commentary as a reply to the topic below, but feel it warrants its own thread. So I move it here.
==========================
The happy talk re the market, and its current decline, continues. Buy, buy, buy; it will recover.

Well, of course it will. But for how low and for how long are you willing to hold positions purchased now (i.e., since this decline began in earnest 4 weeks ago)? Down 5%, 10%, 20%? How about down 30-50%? How about down only 15-20% but the stock requires months, perhaps even years, before recovering to the price you paid? These are questions for which you should know your answer BEFORE you purchase.

Nota bene the willingness to purchase the former leaders; this is a great failing of most investors -- the inability to discern change. This effect can be seem as stocks tumble from obvious up trends into short term down trends. ("Oh my, where did THAT come from?") as well as long term up trends that morph into something worse, much worse, than a decline that endures only in the short term. ("Buy the dips!") Well, yeah, buy the dips, but place those dips within context of its grander pattern. I suppose stated more pithily, I argue to "watch for change".


I am not making predictions, as I am loathe to do so -- there is NO upside, no benefit to the effort -- but this decline appears set to worsen before it improves. Oh sure, it could continue to feint up -- it might even levitate at these levels for weeks yet -- but each of those feints (including one possible from this morning's lows), when considered on their own merits, lack ALL the clues of sustainability, leave alone a reversal of trend. And when you see the support levels you identified give way, if not crumble, then understand one item, if nothing other: this decline is different from others of recent years.

Nonetheless, it is during the throes of declines such as this one that I accumulate my positions. I rub my hands in glee at the lessened-, if not low-risk opportunities soon to present themselves.

-- David M Gordon / The Deipnosophist

06 June 2006

Circling the drain

It is rare, indeed, when so many chart patterns look so horrid. Must everything go down the drain concurrently? I warned ~5-6 weeks ago that the former leaders (resources, materials, cyclical, etc) looked toppy, and would decline hard, and suddenly. But the many attempts to create a rotational market -- to possible new leaders from the erstwhile leaders -- are met with a ceiling of selling pressure. Talk about surface tension! Market pros tried the consumer non-durables -- no luck; they tried the chicken cyclicals -- again, no luck. And so it goes.

It amazes me to see so many bearish patterns cluster as they do now, and across sectors and groups. It appears all but obvious, at least to me, that this decline will become increasingly painful before it improves. Do not allow yourself (or your portfolio) to be suckered into the market, or you likely will be sucker-punched by the market. Sorry, Greg, but your selections of BHP, CCJ, RTP, and the railroads as possible investment opportunities look equally horrid to the rest of the market.

Here is an interesting email I just now received...
"There was a time in the past when I would have been lured back into the market by the movement of the last few days and then upset with today (yesterday). Instead, I went about what I do with nary a care."
Yeah, ain't that the truth!
-- David M Gordon / The Deipnosophist

01 June 2006

Off the charts

Reader, Greg Reiman and I enjoy an interesting discussion here. But I was AWOL yesterday, as I felt horrible all day. And that was before visiting my Dr. for my regular quarterly visit, at which moment he decided to share some startling news re my 'charts'. Oh well; life continues. (I hope :-)

Now I attempt to parse this interesting follow-on comment from Greg. And as I wondered at my ability to be as pithy as is he, I move this part of the conversation here, where there are no software-imposed limits on my logorrhea.
I hope you are wrong about the resumption of the bearish trend. I do not have your unique technical analysis & pattern recognition skills, so I will have to wait for the market tell me it's intentions. Fortunately, as you said, the market does not move in a straight line, it tests support and resistence along the way, providing opportunities to trade, although most of us still do better in an uptrend.

I need to correct my earlier statement; BHP, CCJ & RTP actually corrected significantly more then the market indexes, 20% to the indexes 10% in round numbers. Their first dip seems to have found support and rebounded 7-10%. In hindsight, this first dip found support at a predictable level and buying at that support level would have been a good short term trade (IMHO). We shall see what the next dip has to offer.

I do not see the signals you see regarding the direction of the resources group. But I would be interested to know what you are looking at and how you interpret those indicators. Regarding the new possible leaders, I am at a total loss, but I am certainly interested in your thoughts.
I appreciate your compliment, but especially your hard-won wisdom on display in your first paragraph. I would offer the following addendums:
1) I too hope I am wrong re the resumption of the bearish trend. But recall my "shatter your assumptions" comments made 6+ years ago: what I suggested then was to lose the mind-set of a trending (up) market and the consequent "each dip is a buy". And that the market averages likely were moving into a sideways trend that could endure for years, even decades. If I am correct, then the recent attempt at the old highs should be rebuffed (as it obviously has), and at some point revisit the lows. It need not decline that low on this swing, but it could. Whether or not it does, all the price action between the circumscribed high and low could be... messy. This type of action denotes a trading range, or base. The sole question is the amount of time this action might endure. Certainly the fundamentals stack up against the market averages to break out into new highs -- and trend higher from that point. Nonetheless, there are always winning sectors and groups (and, of course, stocks) during this assumed base-building period. Investors have a choice: time the market's or stock's price swings (especially beneficial during a sideways-trending market) or find trending sectors and groups and purchase (and hang on) to the leading stocks in each for the trending action. That will occur despite the markets many frightful declines (yet to come).
2) I perceive market action differently from most market participants, as you note. To wit, I seek resistance during an up trend (and assume support as axiomatic), whereas I seek support during a downtrend (and assume resistance as axiomatic). This perception is perhaps counter-intuitive, but consider that trends -- up or down -- frequently are rebuffed against their primary trend. Thus, within primary movements, I seek short and intermediate term inflection points as natural points of temporary reversals.
3) Yes, we do better in an uptrend, if we invest primarily on the long side. Vice-versa is obviously true, as well. How many investors do you know, however, who want to 'predict' market action, especially against the prevailing trend, as a means to impress us all with their self-bellowing intelligence?

This blog is my record of sharing what I see, as I see it, and in real time. It always helps me to receive questions, as I often forget or neglect items I should or meant to include. It also is difficult to be as fully revelatory as possible while keeping in mind each reader's experience and knowledge. How much do I share without confusing readers? Too, I must rid each post of jargon and other items that could confuse, including my beloved metaphors. I find those items merely confuse readers rather than help. So in the attempt at writing for all, I still leave behind many readers.

Your comments and questions are welcomed, as always!
-- David M Gordon / The Deipnosophist

who's online