Google

The Deipnosophist

Where the science of investing becomes an art of living

My Photo
Name:
Location: Summerlin, Nevada, United States

A private investor for 20+ years, I manage private portfolios and write about investing. You can read my market musings on three different sites: 1) The Deipnosophist, dedicated to teaching the market's processes and mechanics; 2) Investment Poetry, a subscription site dedicated to real time investment recommendations; and 3) Seeking Alpha, a combination of the other two sites with a mix of reprints from this site and all-original content. See you here, there, or the other site!

31 March 2005

Bottom fishing

Eh, what's that you say? You don't like buying stocks that already are running, too much risk even for the potential extra return... You instead prefer those stocks that presumably are in the process of building a long term bottom; thus, a limited risk exposure while granting for the lessened rate of return.

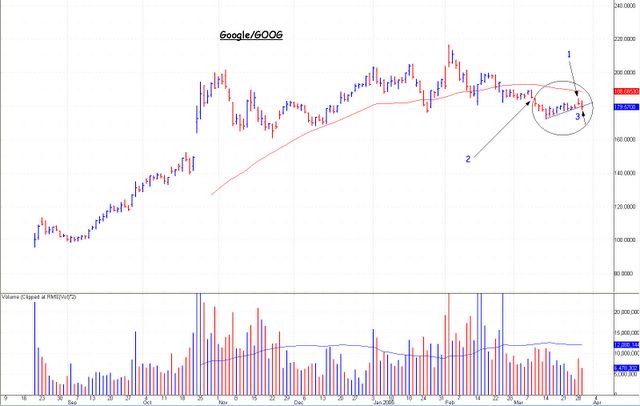
(NB: To articulate the difference I note above, note that those stocks already running -- breaking away from intermediate term bases within long term uptrends -- will chow down more points more quickly than those stocks that are in process of presumably building a bottom.)

Nonetheless, you prefer the secondary and tertiary stocks (this measure does not necessaily apply to the companies) because you do not like risk. Fine. Let's cycle back to the retailers, and examine two such opportunities. Gottschalks/GOT was already mentioned. Although its very recent action (the past ~2 weeks) appears to be a small base, it likewise appears to be setting up for an assault on higher prices. But do examine the weekly basis chart.

Saks/SKS also looks interesting...

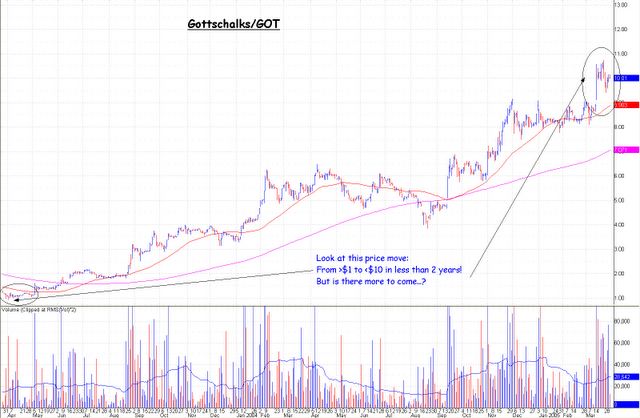
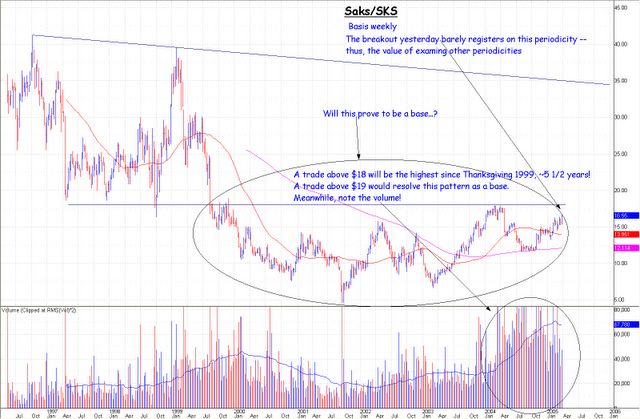
In other words, this rotation from the former leaders into the new leaders -- the chicken cyclicals -- is not limited to the specialty retailers; both GOT and SKS are department stores! (In fact, this rotation to the chicken cyclicals also is not limited to the specialty restaurants. That is, I have not already shared all the leading groups, nor even the participants in each group.) Can you find and share others...?

30 March 2005

Head Fake?

After opening higher and trading strongly before reversing and closing down for the past several days, many pros are on high alert for the same to occur today. The market is now within the "Magic 20 minutes"; if it does decline, now would be the appropriate moment for that decline to begin. (In fact, even as I write, the COMPX already has lost ~7 points of the previous +30...)

But do not allow a possible head fake to become a head butt; this trade is too obvious. Stick to your knitting. We soon shall see how this affair plays out.

More chickens...

Money in motion (MiM) is a founding principle of professional investors. As markets in general decline (as per recent experience), new leaders emerge as investors rotate from the former leaders to the new leaders.

This is not a zero-sum game, as evinced by the markets over the month of March 2005; those former positions typically are sold in toto whereas the new leaders are only nibbled. Thus the markets in general decline while the new leaders emerge. (Is that an echo?) This specific action manifests first as not declining with the general market, and when the portfolio blowout becomes extreme they emerge into new highs.

The chicken cyclicals are the new leaders. I have previously shared the retailers, and this post recommends the restaurants. Of course, several of these companies will be familiar as I have previously recommended them here...

If you have not already purchased the two companies below, despite my many recommendations to do so, then what do you wait for -- a ringing bell? A message from God?

Starbucks/SBUX has been the group leader, although it has held that status for a long time now. It is possible that it nears completion of another intermediate term base, although this pattern is too much caught in the pincers.

Panera/PNRA is indubitably the group's leader for the recent past. It has yet to find universal favor among institutional investors, unlike Starbucks; therefore, the shares likely have more room to the upside.

Darden/DRI is favored among institutional investors. Nonetheless, it too has plenty of room on the upside. (In fact, I just purchased more shares yesterday during its brief foray below $30.)

Red Robin/RRGB looks especially exciting because it has yet to emerge from its presumed intermediate term base. And as subscribers know, I love this particular pattern.

Can you find other possibilities? Please share...

Excellent computer utility

This company charges something for most of its products; this great little utility, however, is one of only two free of charge. And quite helpful.

29 March 2005

Raindrops

Stocks do trade distinct from the parent company, no matter the amount of foreseen opportunity. An example would be Google/GOOG. I believe this specific opportunity to be especially exciting; nonetheless, the share price will do its own thing...

Yesterday, the shares rallied to key resistance (point 1) in a throw-back rally to the earlier breakdown (point 2) before reversing hard. Today, the share price breached its minor up trend line (point 3).

What does this mean for you? That more price weakness will occur in the short term while the shares build what I presume is a base in the intermediate term. The decline might exhaust itself at ~$170, ~$160, or even ~$140, but $180 is unlikely. I want to be clear: the low for the possible base is not yet in. What could change this thesis? A sudden burst through and close above the 50 day sma; such action would translate this base as being one more of time rather than price (decline).

Nonetheless, this post serves as a warning of potential price risk. If you can see beyond the valley of ephemerally lower prices and prefer to hold, good for you. I sold my shares ~3 weeks ago, however, when support was breached (point 2); I reported this fact then. I prefer to have both cash and a clear mind - unsullied from worries about "how low it might go" - for a better price... and an even better value.

25 March 2005

Post mortem

Flir Systems/FLIR was a beautiful pattern, despoiled only yesterday. There are, however, some items (among many) that we should note...

1) In the ideal setup, three higher highs would follow the successful breakout; FLIR unfortunately had only one (arguably two),
2) The handle part of this pattern should not exceed 3 weeks. When the shares arrived at that point (yesterday) with no signs of a bounce, traders gave up and sold, thus causing the shares to break down beneath the 50 day sma,
3) FLIR subsequently plummeted to critical support at its 200 day sma and a long term trend line.
4) The high volume yesterday plus holding at double support could mean the shares will arrest their decline at this level.

Will yesterday's high volume and drop to the double support end this short term decline? Time will tell, but when examined with how others in this same group have recently traded (e.g., Armor Holdings/AH and Ceradyne/CRDN), it is a wonder FLIR held up as long, and as well, as it has. Whoever said the markets are not a continuous source of surprise?

23 March 2005

Straight down

The markets have endured a seriously hellacious ride since I posted this warning. (Only the day before, the markets had traded at fresh recovery highs!) To update: during the past two weeks, equities have made a beeline straight down to lower prices, bond prices have plummeted (and interest rates have soared), and the price for oil has nudged higher. The US$, however, is in the process of possibly reversing its 3-years long trend, from down to up. (Not yet, however; a confirmed reversal requires a price rally above ~86 on the DXC.)

As I had suggested, inter-market dynamics were changing -- quickly -- and the mounting risk would manifest as sharply lower prices. Which is precisely what we have seen.

The snippet that follows is from Tim Villano's Trader's Focus comments made this morning...
"The bottom line on the stock market is that the new daily reaction highs and rally to (SPX 1230) in early March represented a clear selling opportunity. With all tech indices in a negative divergent position, the Commercial stock index Futures traders lined up against the tape, and eventually the (SPX 1193) mark giving way, the stock market simply remains in a breakdown mode...."

I will update my general market thoughts (as opposed to specific opportunities, of which there remains an abundance!) this weekend.

21 March 2005

Sinking Globalization

Over the past ~2 years, I have read several articles and books by Niall Ferguson, and while typically I sing hosannas to his brilliance, at times he can be a blithering idiot. (Well, perhaps not that bad but you know what I mean.) This essay, however, simply astounds the reader for its clarity of thesis, the cogency of its thoughts, and the timeliness of its insights. In brief, pretty phenomenal.

Of course (and as always), I am interested in your comments...

Our Literary Leaders

This article is a fascinating albeit brief introduction to the reading habits (and tastes) of our Presidents. (And proves my thesis that reading is a good habit for everyone.)

In the White House, TR was that rarest of animals: a man of action who could not live without a book in his hand. "To succeed in getting measures like these through [Congress] one has to be a rough and tumble man one's self," Roosevelt explained to the British historian G.M. Trevelyan, "and I find it a great comfort to like all kinds of books, and to get a half-an-hour or an hour's complete rest and complete detachment from the fighting of the moment by plunging into the genius and misdeeds of Marlborough . . . or in short anything that Macaulay wrote . . . or any one of most of the novels of Scott, or some of the novels of Thackeray and Dickens."

Check out the entire article...

18 March 2005

Fleet of foot, but not ephemeral

Because jogging shoes quickly lose the spring in their step, Nike/NKE is arguably the poster child for the consumer non-durables sector, aka the chicken cyclicals. And yet its share price is anything but ephemeral, as it hovers just beneath its all-time high.

Nike/NKE is an example of tracking an opportunity ad infinitum waiting for the preponderance of evidence. It has the requisite set-up and trend, or 2 of the 4 aspects that I seek (price, volume, pattern/set-up, and trend). The breakout from this pattern (which I presume to be an intermediate term base within its long term up trend) would manifest a change in (price) direction. Volume, the handmaiden of price, would occur before and/or during the price breakout to confirm the action.

However, the breakout from this particular pattern likely will not occur for weeks, perhaps months. Until then, I wait and watch, not allowing Nike/NKE (and similiar opportunities) to drop off my radar screen. While waiting I take action elsewhere, such as purchasing Walgreen/WAG during the test of its 50-day sma (simple moving average).

More durable than non-durable...

Herman Miller/MLHR, the maker of office furniture (including the Aeron chair), breaks out above a massive base, with explosive volume.


The size and quality of this breakout, however, is more evident when viewing the weekly chart.

MLHR shares easily took out resistance at ~$30 (a price it has not traded above for 4 1/2 years) and the line of declining tops from the all-time high set seven years ago. No wonder total volume during yesterday's breakout was so explosive, and provides at least one answer to Yash's question asked earlier.

15 March 2005

Ka-BOOM!

Subscribers to my newsletter, dmg's Trading Alerts, will recall these two prior recommendations. This is not a thinly veiled effort to crow over past successes, but instead an exercise to study the setups that build before an explosive move to higher prices. (I am too often wrong to crow about the occasional lucky guess.)

The ability to recognize patterns enables investors to find more of these types of opportunities in the future.

14 March 2005

The chickens come home to roost

So while the market's former upside leaders now become leaders to the downside, perhaps tugging down, down, down the markets in general (although a bounce from prices lower than Friday's close could occur any day), the consumer non-durables -- the chicken cyclicals -- suddenly come to the fore, and assume market leadership. (And not so suddenly in the case of some.) For example:

Hershey/HSY broke out above a 6 year base ~15 months ago. The share price has since roared ahead from $40 to $65. How about that action for a stolid blue chip ...?


Johnson & Johnson/JNJ sneaks out from a base of three years to a new all time high. JNJ could pull back because the required explosive volume has been absent on this move...


Walgreens/WAG has risen powerfully the past 3 or 4 months, with excellent volume. The share price now is within spitting distance of its all time high ($45.75) set 4 1/2 years ago. And all this for a drug store.


How about Urban Outfitters/URBN? The company appears expensive on fundamentals and valuation measures. The company, however, repeatedly reports phenomenal numbers. And never forget: good stocks almost always are expensive, lousy stocks tend to be cheap. And the power and duration of the rocket ship ride this stock has enjoyed might cause investors to fret all the more.


And, finally, Men's Wearhouse/MW. This company's shares only recently broke above its all time ($36.75) set ~6 1/2 years ago. Oh yeah, and with explosive volume...


There are other examples, American Eagle/AEOS, bebe Stores/BEBE, Cheesecake Factory/CAKE, and even Gottschalks/GOT. It is notable that select retailers suddenly perk up. But then, as a group, the retailers are the chicken cyclicals.

13 March 2005

The Cup & Handle

The cup & handle pattern is often seen but rarely confirmed -- just like Nellie in Loch Ness. The high incidence of sightings is due mostly to observers not knowing the rules of the pattern. So a primer, of sorts...

The Cup & Handle pattern is eponymously descriptive: after a strong upward move, the stock will pull back, and then return to the area of the recent high forming the distinctive shape of a cup. On the right side of the cup a handle forms as the stock trades within a well defined range for 1-3 weeks. The handle may show movement horizontally or with a downward slope. This pattern, then, seems sufficiently straight-forward, so how and where do the problems of interpretation occur? By the perceiver not applying the rules:

1) The Cup typically retraces about 15 to 35% of the recent price high. It must be shaped in the form of a "U" (or saucer-like), not a "V". It must not retrace more than 50% from the high. (This rule excludes all those stocks that have declined from $100 to $1/share, and then build the appearance of the pattern without abiding by its rules.) In addition, the cup should be several weeks to six months in duration.
2) The Handle must form in the upper half of the Cup and show generally decreasing volume. The high of the handle should be within about 5% of the high on the left side of the Cup. The low of the Handle should not be more than about 15% off the high of the handle.
3) Entry Point: when the price rises above the declining trend line formed over the highs of the Handle, or when the price rises above the high of the handle. The volume should be above average daily volume -- preferably explosively more -- on the day of the breakout.
4) Stop losses may be placed below the low of the handle, or ~$1 below the trend line formed across the highs of the handle.

The chart below shows a current example... (Yes, it is once again Flir Systems/FLIR.)


1) After a powerful advance (~$13 to ~$33), FLIR declined from that high trade of $33.34 (on 8.23.04) to a low of $24.59, a 26% decline. Confirmed. (Decline of <50%)
2) The cup (or base) endures for ~6 months until it breakouts with volume to new highs. Confirmed.
3) The high of the handle is within 5% of the erstwhile high, $34.95 new high vs the former high of $33.34. Confirmed.
4) The handle has so far consumed one week of an allowable three weeks. Confirmed.
5) Volume (in the handle) has diminished -- albeit with the notable exception of two large blocks that crossed in the closing 10 minutes of Friday's activity. Confirmed.

How does a setup and pattern become despoiled? Typically, via weakness in the markets at large. So maintain diligence, discipline, and patience, and recall always that stocks oscillate. Your objective, however, is to profit from those oscillations. And your task is two-fold:
1) To obey the entry and stop loss mandates as elucidated above, and
2) To share here (via the Comments link) the names of other stocks whose chart patterns display this cup & handle pattern. Heck, I have not somehow cornered the market in good (trading) ideas! (But do not neglect the rules for this particular pattern!)

I've just seen a place

In a moment of serendipity, I happened upon new writer, David Forbes' online journal mere hours after he created it. Although not myself a writer, I regard writing as a noble profession, and thus place a high value on the writers themselves. (Only one reason for the many and increasing list of recommended books, etc in the sidebar!)

And as I commented to David, I look forward to his future blog entries to understand better the work that lies behind the magic. BTW, if you too are interested in following David's travails, please note that I added his Journal to this blog's Sites I Like for easy access...

Ten Things I Have Learned

Renowned and well-regarded graphic designer and artist, Milton Glaser, shares his thoughts about life, work, and whittling down each to, "... do things the best that we can." I find these thoughts interesting, despite the many infelicities of syntax that abound...

10 March 2005

Well, geez...

Am I the only person who was unable to view this blog all day today? And here I was, all set to post reams of data, new links for the sidebar, and even respond to your comments. (Yes, now that a slight bug has been overcome, I actually can and do reply to your comments! Remember, my objective is to make this site interactive..)

Chime in with a reply, and let me know whether you, too, had problems accessing this site, and whether the font size for this post is too small to see.

Tim V chimes in...

The following snippet is from Tim Villano's comments this morning:

"Yesterday's stock market sell-off was an intermarket event with rate-sensitive groups pressured by declining Treasury prices. On the Monday, February 28 conference call, clients were advised that the Ten Year Notes Futures (TY108-295) had slipped into a downside pivot ... On that same conference call we advised that the Philly Bank Index (BKX -1.54 99.69) had been weakened technically and likely would not confirm new general market highs for the Dow and SPX. We also mentioned, and reiterated on yesterday's conference call, that several BKX components had slipped into uniformly negative patterns. I also would emphasize for the Bank Index that a decline below (BKX 99) will reinforce the notion of a weekly topping process, which could further support an interim or longer-term topping process for the stock market, especially with several "big picture" indicators, including recent CFTC data, in a negative posture... We still expect some recovery into next week's expiration, but clients should be clear that important data points and intermarket activity are pointing to a multi-week to multi-month high developing in the month of March. (Italics mine -- dmg) We have already seen that important indices like the Bank Index (BKX), the Biotech Index (BTK) and the Retail Index (RLX) have been reluctant to move to new highs with the general market."

Beauty is in the eye of the beholder, and so too is risk...

09 March 2005

All bets are off (the table)

Please do not interpret the comments that follow as a prediction of market direction, but as my perception of market risk. Which has just now, based on recent intermarket action, increased manifold.

Early warning shots over the bow were the breakdowns of various market leaders; for example, Symantec/SYMC and especially eBay/EBAY (and the fact that EBAY again rolls over). More recently, there is the volume-deficient throw-back rally in favored investment, Starbucks/SBUX. In addition, Google/GOOG has today breached its intermediate term line of support. (I have sold these last two stocks.) Moreover, Apple/AAPL too looks set to suffer a bout of 'sudden failure'. Although other favored investments (Cheesecake Factory/CAKE, Johnson & Johnson/JNJ, and Whole Foods Markets/WFMI) continue to make new all time highs, their trends could be tested in the short term. Obviously, this grocery list purposefully highlights the market's leaders, not its coevals, laggards, and sluggards because I prefer my investments to be market (and markets') leaders.

What causes this sudden bout of market consternation and personal angst? The increasing price for oil and other commodities, the failure of the US$ to abort its long term down trend (and instead to renew it), and the sudden and ferocious ratchet upwards of interest rates in the credit markets. Treasury notes and bonds are now at yields not seen for 6-8 months. Do not take solace that this move upward in yields is only to 6 month highs; instead consider the change in direction, the ferocity with which it occurs, and the likelihood that this new trend, if not its trajectory, will continue. Higher rates mean a slower economy, albeit with a lag. But when the investor admits to the leverage inherent in today's economy...

Conflated by stock valuations that are stretched, the market likely will decline soon. And hard. But as hard as this potential decline might be, it will mask the exsanguinating that individual stocks will suffer. And of course, that hiss (you soon will) hear will be the air escaping from the balloon that is the real estate market.
(Yeah, yeah, I know -- but I just had to slip in that comment! ;-)

Each of us have our own risk tolerances and time frames. Even should the markets suffer a nasty decline they also will recover. Perhaps to recovery highs. And of course there always will be specific stocks, groups, and sectors that rise in the face of a general market decline. Day-to-day oscillations in the markets tend to mask what really transpires under the surface (the averages); in the near future, carnage on the margin.

So as I mentioned, this post serves as a warning of risk, not a prediction of direction.

06 March 2005

The Quest for Certainty

Anyone who is familiar with my investing methodology knows how I feel about certainty. And the purchase of breakouts, whether from an area pattern, a trend line, or etc is a form of acting only at a moment of presumed certainty.

For example, during the past 12-13 weeks (check those archives!), I repeatedly suggested that Flir Systems/FLIR warrants your attention (read: buying interest). The called-for breakout was ~$32, the stop ~$28, and the potential trader's reward a quick rise to ~$42-44. Moreover, I stated this rise should begin approximately late-February.

My methodology, to purchase weakness and sell strength, means that, in this instance, I am a buyer as close as possible to the stop ($28), which serves to lessen the risk. Why instead lessen the reward by waiting until the breakout above $32? (Since achieved on Friday, 4 March; see chart below.)


Although this chart pattern counts to $42-44, it does not betray how or when it will arrive at that level: straight up, or in a meandering manner. (BTW, this does not equal that it cannot rise farther, or even that it will achieve the count.) So what benefit accrues from waiting for the breakout to occur before buying? You would instead pay $32, $33, or $34 while still maintaining the same stop level, $28. All the trader or investor accomplishes by waiting is increasing his or her exposure, and thus risk. The by-product of certainty is a higher price, increased risk, and lessened reward.

After a breakout occurs are several scenarios of equal likelihood:
*50% of the time it tests the breakout, and
*50% of the time the stock runs.

Furthermore,
*50% of the time the shares scream immediately higher, whereas
*50% of the time the shares meander to their objective...

...If the shares even rally to the objective.

And t
his reason is only one of why I rely on volume to lead and/or confirm a breakout. (In fact, volume is one of my critical four indicators, with the other three being price, pattern, and trend.) The confirming volume that occurred on Friday's breakout, combined with the leading volume that occurred on the scheduled day (Wednesday, 24 February) offers augeries for the positive resolution of this specific opportunity.

Life got you down...?

Then try the new prescription medicine that promises to cure all ailments for everyone...!


04 March 2005

Is Google a $50 Billion "One Trick Pony"?

From Briefing.com:
"BusinessWeek reports a handful of analysts increasingly are questioning whether Google's laser-like focus on search may be something of an Achilles' heel.

"According to the article, Google remains almost entirely dependent for growth on search -- a business that's poised to slow. Google also is just beginning to entice big traditional advertisers to search. Of the world's 1,000 largest companies, Google can boast only 227 as advertisers. (This fact is an opportunity for even more growth, obvious to Google and even to me. Imagine the explosion in revenues when the tipping point occurs, and those other 773 companies realize the folly of their theretofore ways. -- dmg) But Google's belief in search may be blinding the company to other opportunities.

"To see what they risk missing out on, Google executives need look no further than key rival Yahoo/YHOO, which tirelessly looks for new business models. (And yet, I am privy to comments from within Yahoo that Google has them on a leash; that Yahoo slavishly mimics everything Google doesn and not as well. -- dmg)
While search accounts for 45% of Yahoo's sales, the portal also snares one-third of its revenues from so-called display ads that contain graphics and multimedia, as well as 16% of sales from subscription services, such as online personals and fantasy football. By comparison, Google gleans 98% of its sales from text ads, primarily placed around search results.

"Meanwhile, one of Google's best shots at building a new revenue stream receives scant attention. Last May, the company began experimenting with display ads -- which run atop or along the side of a Web page. It's enticing for big advertisers who are often as concerned with building their brand as they are with driving traffic. The article notes Google, rightly, has plenty to tackle in its core business of search. But those aren't the only opportunities for the search kingpin. Others deserve exploration, lest its narrow focus become a case of tunnel vision
." (End quote from Briefing.com)

Yawn. This is no mere misunderstanding of the company's goal; it is not understanding it at all. This
article, from the Washington Post, states clearly the leadership that Google represents.

"Bring it on, Google. Bring us more shortcuts, one-click look-ups and Googlespeak, that strange language your engineers cook up to make it easy for us to pose queries. Do whatever it takes to save us time and tedious typing."

"Google doesn't face Microsoft's monopoly worries (not yet, anyway), and its implementation seems more considerate of both Web users and publishers. One big difference is that Google shows pages with no hyperlinks added first and lets users decide when to add them. Users have to click the AutoLink button every time they visit a new Web page if they want to add hyperlinks."


We already know the short term breakdown for GOOG shares (~$185), which would usher in tests of ~$176, and then possibly ~$160. The upside breakouts, however, remain at $190, $193, and then $200. If GOOG were to surmount these points of resistance, then watch for ~$220+…

02 March 2005

Mail Call

I received a very nice note yesterday. The writer shall remain anonymous (because I did not request his or her permission before sharing here). It says, simply:

"So glad to see you're back to your old (and profitable) tricks. Visit the oil complex when you find yourself bored."

Heck, anyone :-) can notice a trend in motion, which after all requires only three data points. (I require only two.) But the ability to recognize a change in direction... ahh, now there's the rub.

Which is why I choose to elucidate opportunities such as Starbucks/SBUX. The more familiar you become with this part of a pattern the less risk you will embrace in the future. And as I share other trend reversal moments (up to down, etc) the less risk your portfolio need assume. Less risk might mean more reward -- it has been known that stocks can continue to decline in price -- but it does mean less worrying.

BTW, having mentioned Starbucks/SBUX... the company reported after the close today its February comps of +9.0 %, vs consensus estimates of +6.7%. Analysts are positive on Starbucks/SBUX following this news release, with BofA Sec noting that, while these results are not quite at the double-digit mark seen throughout 2004, they still are above the high end of management's long-term forecast of 3-7%, and ahead of the analyst's expectations for 7%. BofA Sec expects the stock to rebound moderately, but would look for an opportunity to revisit their view on the shares in the coming months if continued single digit comps cause weakness in the stock. Investors should expect same-store sales to remain in the upper-single-digit range for 2005. Maintains its "Neutral" rating... UBS notes the solid Feb SSS should turn investor focus back towards SBUX's unique EPS growth profile and away from the multiple compression risk that could come from a deceleration in traffic growth. In their view, SBUX could grow eps by 25% per year -- less than the 28% CAGR over the last 4 years but well above the 20% L-T eps growth Wall Street forecast. Maintains its "Buy" rating.

The shares, which already had closed at $52.81 (+23¢) screamed higher in after hours trading, with the most recent trade at $54.50 (+$1.69). Do not forget, however, about the previously mentioned resistance at ~$55... To parody the Miller Lite commercial: less risk, more reward.

01 March 2005

SBUX breaks out

Volume Alert: Starbucks/SBUX trades to new session high ($52.70) on spike in volume...

This volume spike occurred because many traders had buy stop orders entered at $52.15+, and thus purchased -- and reified! -- the aforementioned breakout. Next resistance at ~$55.

Congratulations to all who boldly stepped up to the plate to purchase at <$49.80 (as per my earlier
instructions), an action taken after a ferocious one-way decline from $64+ -- and, to the beginning trader, looking lower yet!

who's online