Updated to include this morning's (Friday, 4 August) brief comment and chart from Dorsey Wright. I also corrected in my text many errors of grammar, syntax, jargon, and assorted confusion; thus a re-reading of the entire post seems a good notion! -- dmg
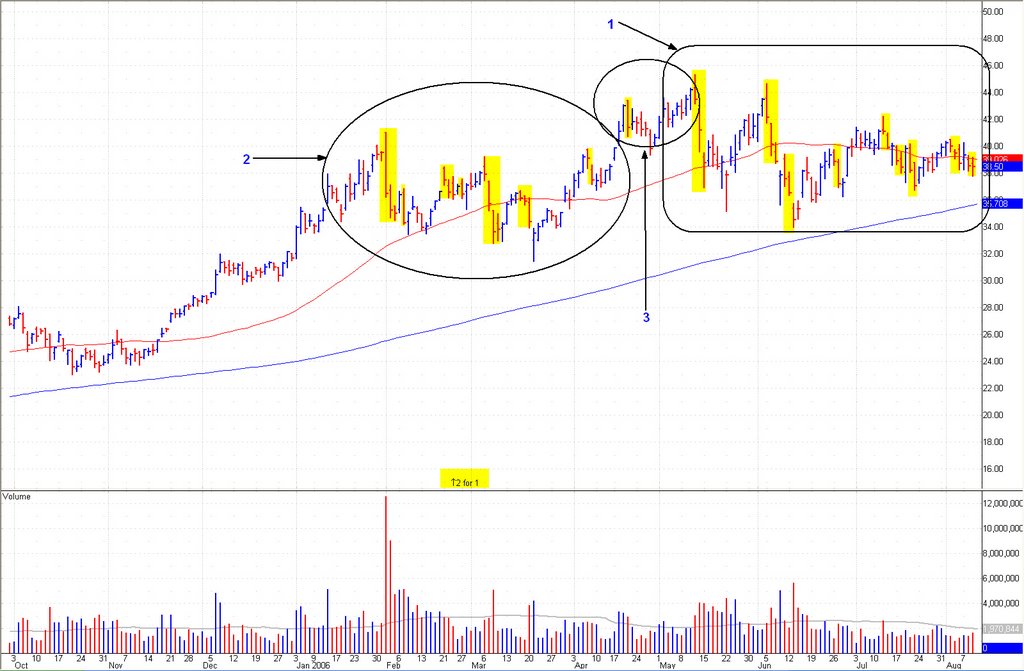
I could populate this Google/GOOG chart (below) with all manner of trend lines, but that attempt would only obfuscate this picture by that amount more. What I hope to show is what I term "simple peak & trough analysis" -- a stock that trends higher should have a visibly apparent pattern of higher highs and higher lows. (A downtrend manifests as lower highs and lower lows, of course.)
Now this rule is true always, although only within the studied periodicity. For example, although it appears Google/GOOG loses upside momentum, a glance at the farther out periodicity (basis weekly) shows this recent action as a possible symmetrical triangle, which typically is a continuation pattern. Unfortunately it appears probable this pattern will be despoiled. Zooming in on the chart action, basis daily...
 [click on image to enlarge]
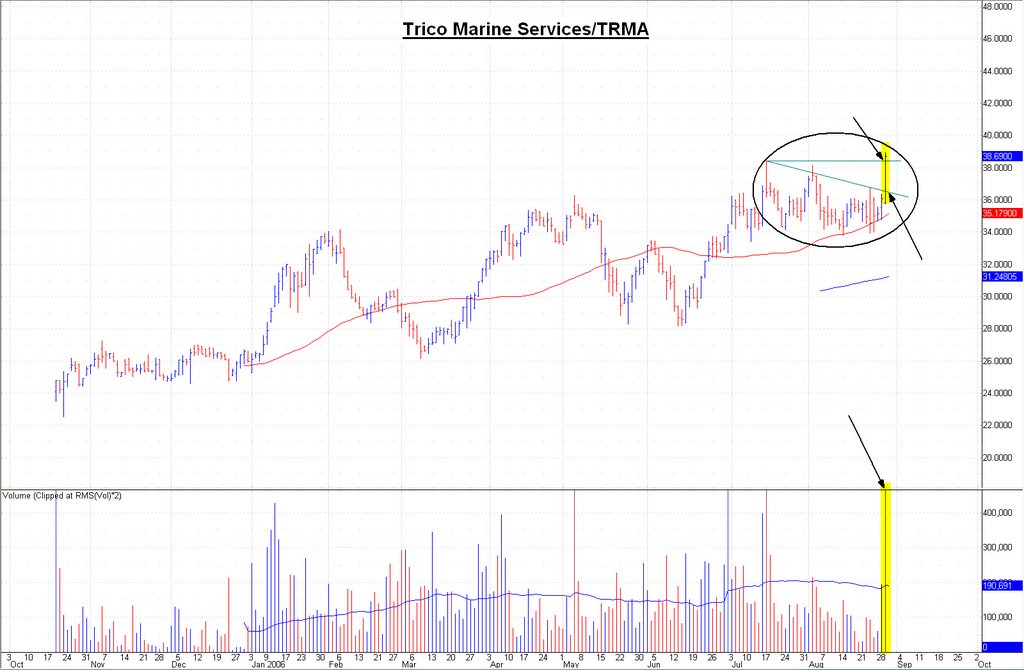
Data point:
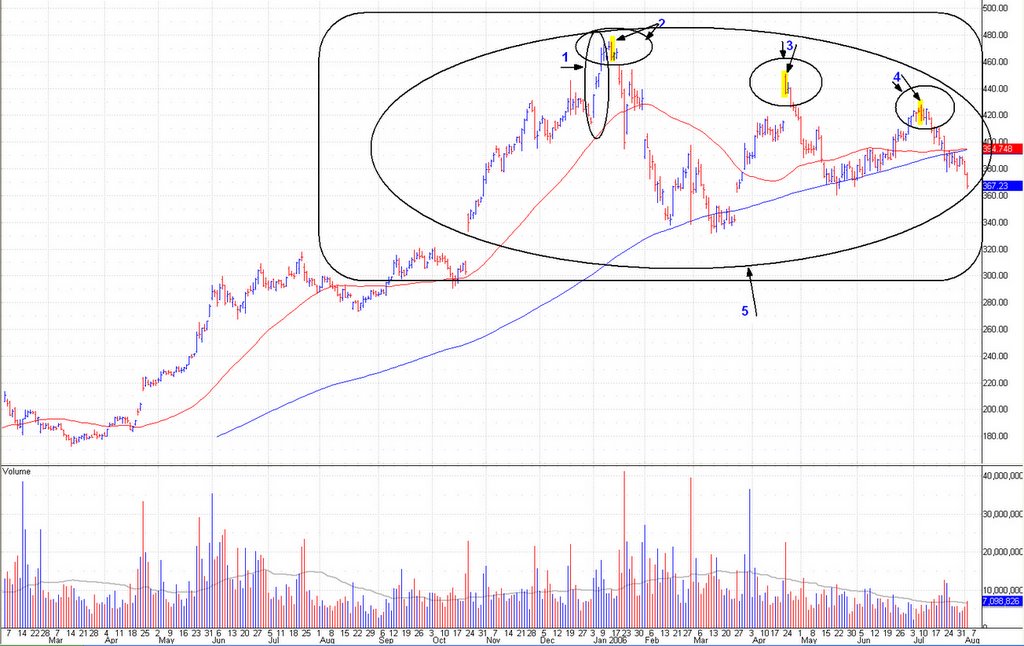
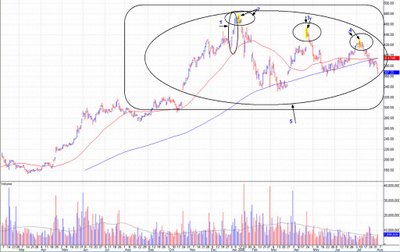
• #1 encircles a possible blow-off (again, daily basis) -- a straight up move of $60 or ~15% in a matter of days. Most measure a blow-off or finishing move as 35% or more in 3 weeks or fewer -- I agree, but make allowance for the foreshortened time frame (days);
• #2 shows an integral reversal day and minor top;
• #3 shows a lower top and another crucial reversal day;
• #4 is the same as #3;
• #5 encapsulates what appears to be an intermediate term top of some potential consequence.
What I neglected to delineate is the pattern of higher lows of mid-March and mid-May. These higher lows provide only two datapoints for the symmetrical triangle apparent on the weekly basis chart. Unfortunately, recent trading action for GOOG shows the minor rising trend line (not shown, but easily drawn) has been breached. This makes the odds increasingly likely that the symmetrical triangle (basis weekly) soon will be an item of the past. That causes the chart to assume an increasingly portentous tilt to that of a potential descending triangle. Yes, support lies below at ~$360, and then again at ~$350 before the crucial, and long-argued, support at $330. Should Google/GOOG decline that low, however, helps create the afore-mentioned descending triangle. It is impossible to discern, at this moment, the near term direction for GOOG.
Is the $100/share decline off its high and seven months of mostly sideways movement sufficient for a new base? If not, will it instead breach support at $360 and $350 and decline again to $330, the low of this range? If yes, will it hold at ~$330 (and gap support)? If it instead breaks down, will the shares decline rapidly or begrudgingly? And if it does break down, how low might be the subsequent low? Lots of questions with no prescient answers.
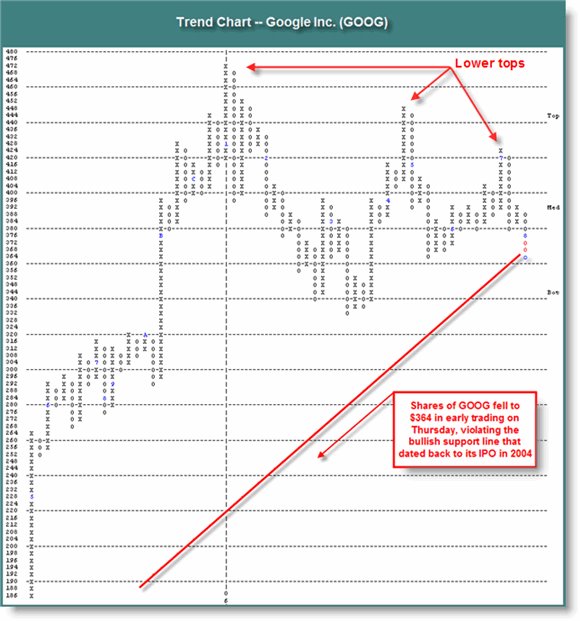
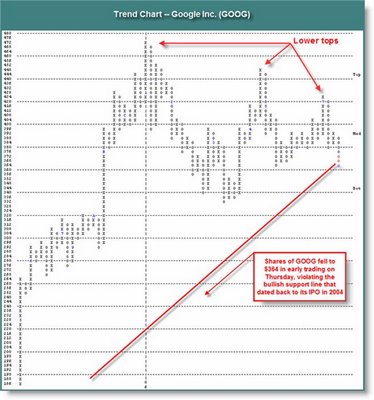
From Dorsey Wright, a service that relies on Point & Figure technical analysis:
"We continue to see a number of troubling signs from the large cap growth arena, to the extent that even Google/GOOG has fallen victim to the forces of supply. After a series of lower tops this year shares of GOOG have violated their long-term bullish support line at $364. GOOG remains a 4 for 5'er, but the trend line that was violated dates back to the IPO period."
[click on image to enlarge]
chart and comment courtesy of and (c) Dorsey Wright
My interest in specific companies/stocks endures for more than a season or two. Well-known and highly regarded companies populate my investing ideas, and I return to them repeatedly for opportunity. Stocks oscillate many times for no better reason than that is what stocks do. Despite this, I cannot help but wonder over the seeming 'disasters' that have befallen favorites such as Rackable Systems/RACK, Starbucks/SBUX, and Whole Foods Markets/WFMI (to name but three such 'disasters'). Remember that price oscillations create the opportunty to buy cheap and sell dear. Thus, it is folly to ignore current price action, and yet these four companies (the three above + Google/GOOG), among others, will remain on my monitor for more than this declining season, as I await a low risk, high reward buying opportunity.
Long term leaders and winners repeatedly get ahead of their valuation measures; Google/GOOG at $475 and arguably $375 is a real time example. While the fundamental numbers (revenues and earnings, growth, etc) pour forth from the Googleplex, the e (earnings) of the PE multiple shrinks (rapidly). But sometimes that is insufficient, so the p (price) shrinks as well, causing the once stratospheric PE to shrivel. That action occurs now. There are fundamental concerns -- there always are -- such as the company's massive capex. But if not this concern, then another; it is always thus.
An extraordinarily gifted and shrewd investor (who prefers remaining anonymous) shares his insights...
"I'm glad you're going to post on GOOG. I've never had a position, but I remain both fascinated and agnostic. For what they're worth (I know, just what you paid for them!) here are my thoughts: I've been watching the poor action. Clearly it could not hold the obvious trend line, even on a moderately positive day. I would guess that it's unlikely to hold the gap support at 360, and is likely to fill the lower gap and test major support at 320. I would not even begin to venture about possible action below that.
"I suppose that my inclination to a negative propostion is based somewhat on the weekly chart, which has failed to show one accumulation week since March. (This notion is crucial! -- dmg) Plus the general market action in so many leaders (or now ex-leaders). It seems that every day something else blows up, and often on very good earnings and, like RACK, not because it was all that bad a child. Day after day I'm seeing what looks to me like institutions selling their winners, booking their profits while they still have them -- across the spectrum -- and rotating into the most beaten down, "safe" names they can find. The averages haven't broken down, but something like 70% of stocks are now trading beneath their 200 days, so it might not be a bear market by definition, but it sure acts like one. I'm making no prognostication as to where the market in general is going, but I do know that every stock on the board that still has big profits in it is extremely vulnerable.
"Last thought. Because technical analysis -- at least as to obvious trend lines and moving averages -- has become so ubiquitous, it has become obvious to me that many fundamental investors are using these breaks to accumulate postions -- hence, the quick washouts and turnarounds that we now see so often on these breaks. However, it also seems to me like these quick turnarounds -- where the fundamentalists are fading the chartists -- usually happen very quickly -- generally within a week -- rarely longer than two weeks. The way GOOG has been trading, dripping and drabbing away -- leads me to believe that the fade-trade won't be at work here."
I cannot say it better than that, so I will not even make the attempt. When embracing opportunity, we simultaneously assume risk. We assume risk as well when avoiding positions. Sometimes it appears the risk of a mono-directional move is greater than others; we invest or avoid during those particular and peculiar moments. This moment (the coming days and weeks; remember, leaders decline begrudgingly, if at all) for Google/GOOG might just be one of those moments. Only time will tell.
-- David M Gordon / The Deipnosophist