The comment below is from Investors Business Daily© (IBD); the supplied chart basis weekly price bars...============================
"ResMed/RMD has been a long-time leader in IBD's Medical-Products group. The stock recently cleared a cup-with-handle pattern during the week ended March 24 (Point 1).
 [click on image to enlarge]
"Its buy point was 43.53, 10 cents above its Feb. 8 intraday high. The correction from peak to trough was a mild 14%. The handle area showed ideal action, drifting lower in light volume (Point 2). Post-breakout price action has been equally impressive. Notice the recent tight trading. ResMed/RMD could be forming a "three-weeks tight" pattern. When a three-weeks-tight pattern occurs, a stock normally closes within 1% of its previous weekly close over a period of three weeks. ResMed/RMD will need big volume to get through another potential buy point at 44.87, 10 cents above its Mar. 21 intraday high." - Ken Shreve
=================================
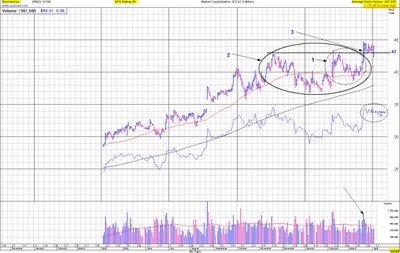
Okay, me (dmg) again. Readers know I too perceive this chart as a cup and handle pattern, but not precisely the same as IBD's Ken Shreve measures it. Why is that? Look at the Daily Graphs (a sister company to IBD) chart (below) basis the daily price bars...
 [click image to enlarge]
Note that area 1 in the chart represents what Mr Shreve perceives as the handle. However,
● The share price fails to breach resistance at the rounded-higher price of $43;
● Even if the investor chooses to view area 1 as the handle portion of the pattern, the rules for the pattern stipulate the handle does not typically endure for 6 weeks. (Which itself is fully half of the elapsed time of the cup portion!) Handles typically endure for 1-3 weeks. Not to be a martinet, but the rules for patterns are of equal importance to their appearance. (NB: today's apothegm in the sidebar to the left)
The cup & handle pattern is a continuation pattern, which means that, upon breaking out of the pattern, the prevailing trend of the greater periodicity reasserts its primacy. In this instance, up. All of which means that his perceived handle (my area 1) is itself part of the cup (area 2 in my chart). And that the breakout from the cup (point 3) ushers in the correctly-identified handle (not identified, but obvious) of the past 2+ weeks.
More important, the shares seem poised to break out above the congestion pattern of the past 2+ weeks, based on yesterday's
● Price reversal (gap down opening, lower price, reversal, positive price change, and a close on or near the day's high);
+
● The time aspect for the handle is near its typical expiration (1-3 weeks);
+
● The mention in today's edition of IBD (the analysis from which I quote above a snippet)
=
a probable breakout from the handle today. If this occurs, then Mr Shreve's "three weeks tight" pattern will fail to be. And instead what investors will have will be a stock that leaves behind its intermediate term base of the past 4+ months and resumes its long term up trend, still in force.
My intention with this post is not to find fault with the analysis of other investors. I merely illustrate how two intelligent people can view the same set of facts and arrive at distinctly different conclusions. If anything 'troubles' me, it would be the reliance on breakouts. (Not really, however; to each his or her own.) How many breakouts does an investor require before finally feeling sufficiently comfortable to buy? Moreover, is noone able to recognize at a glance the prevailing long term up trend? Fortunately, readers of this blog have enjoyed ample opportunity to purchase shares -- and at favorable prices compared to those soon to come -- before the next "potential buy point at $44.87, 10 cents above its March 21 intraday high."
I own the shares. Do you...?
-- David M Gordon / The Deipnosophist


