Google

The Deipnosophist

Where the science of investing becomes an art of living

My Photo
Name:
Location: Summerlin, Nevada, United States

A private investor for 20+ years, I manage private portfolios and write about investing. You can read my market musings on three different sites: 1) The Deipnosophist, dedicated to teaching the market's processes and mechanics; 2) Investment Poetry, a subscription site dedicated to real time investment recommendations; and 3) Seeking Alpha, a combination of the other two sites with a mix of reprints from this site and all-original content. See you here, there, or the other site!

31 March 2006

"Safe and restful, sleep, sleep, sleep"

Some readers have been asking, now that Garmin/GRMN has traded to your pre-defined objective of $84-85 ("Wow! How do you do that, and with such precision?"), what's next. What's next for GRMN shares? And what does an investor do now, especially if he or she sold the shares?

First, despite the sudden decline, Garmin/GRMN has not built a bearish pattern, including a head & shoulders top. The stock did achieve its objective as supplied by the count of the pattern previous. Now it rests, as the shares build another, different area pattern, as it seeks now the low end of this new range and before moving to higher highs. But I (we?) received the trade results we sought (profits), as the shares raced to $85 from $65. (Although I sold out earlier, at $81.) So what's next? Well, if you like how this particular pattern works, the correctly-identified cup & handle, then consider ResMed/RMD, which has shaped up so similarly as to be the same.


ResMed/RMD is a developer, manufacturer and distributor of medical equipment for treating, diagnosing and managing sleep-disordered breathing (SDB). SDB includes obstructive sleep apnea (OSA) and other respiratory disorders that occur during sleep. For the six months ended 31 December 2005, ResMed's revenues rose 43% to $273.5M. Net income rose 24% to $38.8M. Revenues reflect an increase in sales flow generators, mask systems, motors and other accessories. Among its primary competitors in this market segment is Respironics/RESP, another market leader that now is in the throes of building a large-ish base. However, ResMed is the business leader: offering best products, and at competitive prices. Readers know I prefer to purchase only leaders; leaders in their business, leaders in the stock market.

[click to enlarge]

The chart (above) shows the past 18 months of trading activity for ResMed/RMD. In a glance, viewers will see quickly that these shares are in a long-term uptrend, to ~$45 from ~$21. Look more closely, however, at the past ~5 months, as the shares have traced out a picture perfect cup & handle pattern. (Please review this blog's archives for the correct aspects and rules of the cup & handle pattern.)

From 21 November 2005 until 21 March 2006 (area 1), the shares based in the cup portion of the handle. But on 21 March, the shares broke out explosively from this portion of the pattern, achieving a new all time high. Since then, precisely 10 days ago, the shares have traced out the picture perfect handle portion of the pattern (area 2) -- drifting sideways to marginally lower in price, and on diminishing volume. While doing this, it has not traded beneath the loosely-identified trend line of former resistance, now quickly becoming important support.

So what's next for ResMed/RMD shares? Chartists who study the rules of a pattern, in addition to its appearance, would realize the handle typically and preferably endures for only 1-3 weeks; the shares today are halfway through that process. Thus, it is only a matter of time -- days only; perhaps even today! -- before the shares again move higher in price, trading above $45, and higher ($50++) soon thereafter. I am already long the shares, and continue to accumulate. In fact, I will purchase more shares today.

Objective: $50++
Trader's stop: $42-41
Investor's stop: $39-38

Do opportunities get much better than this? I like the business. I like the opportunity. And I really like the chart. I like the odds. At its current price, the reward = ~$7 (initial) and risk = ~$2, a better than 3:1 reward to risk ratio.

As always, I welcome your questions or comments.
-- David M Gordon / The Deipnosophist

30 March 2006

Corporate profits still very strong

The following comments are from Scott Grannis, Chief Economist at Western Asset Management...
-- David M Gordon / The Deipnosophist
~~~~~~~~~~~~~~~~~~~~~~~~~~~~~~~

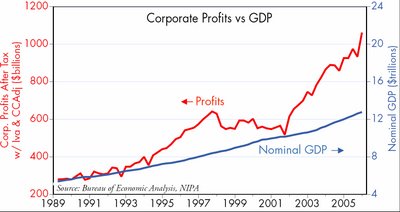
Along with the final revision to fourth quarter GDP (growth revised upwards slightly to 1.7%, inflation revised upwards to 3.5%), BEA today released their calculation of corporations' after-tax economic profits, and it was a barn-burner of a number. Profits rose 9.4% in 2005, compared to 2004, and fourth quarter profits soared to 8.3% of nominal GDP, the highest ratio on record. Profits have more than doubled from their 2001 low. Corporations' net cash flow was $1.4 trillion at an annualized rate in the fourth quarter (fully one-eighth of GDP!), up 18.5% from a year ago. Simply put, there's a heck of a lot of positive stuff goin' on out there.

[click on image to enlarge]

Since NIPA profits typically lead GAAP profits, we can infer that reported earnings will remain very strong for at least the next 6-9 months. This further suggests that equities remain attractive. Using Laffer's capitalized profits model, equities continue to be a steal.


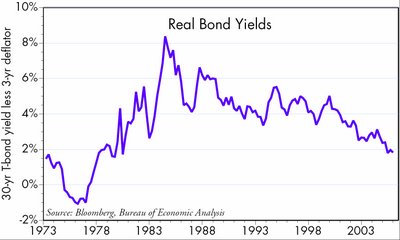
Bonds, meanwhile, do not look very attractive. The second chart subtracts a 3-year moving average of inflation, as measured by the GDP deflator, from current bond yields (arguably a better measure of inflation and inflation expectations than current core rates). Real yields by this measure haven't been so low since 1979-80.

29 March 2006

Commodity update - prices still rising

The following comments are from Scott Grannis, Chief Economist at Western Asset Management.

-- David M Gordon / The Deipnosophist
~~~~~~~~~~~~~~~~~~~~~~~~~~~~~~~~
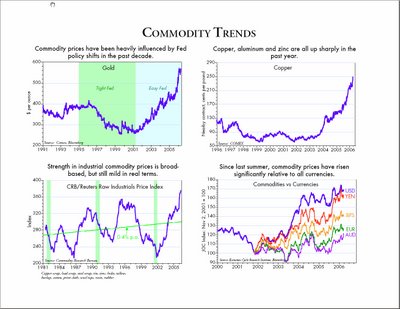
When the great majority of commodity prices moves in one direction or another, you have to suspect some underlying causal factor such as cyclical forces or monetary forces. From my perspective, monetary forces have been dominant for most of the past decade. Tight Fed policy pushed most commodity prices lower in the late 1990s, despite impressive growth in the U.S. and most global economies. Commodity prices began to rally in late 2001/early 2002 despite relatively sluggish global growth conditions, thanks largely to easy Fed policy. Today, money is no longer easy, but neither is it particularly tight: the real Fed funds rate today is close to its 2.3% average since 1960. With the notable exceptions of agricultural commodities and textiles, most commodity prices today continue to rise, with spectacular gains in copper, zinc and aluminum prices. The bottom right chart (below) suggests that recent commodity price gains have been driven mostly by rising demand/global growth, rather than by Fed policy, since commodity prices have increased significantly relative to all currencies since last summer.

[click image to enlarge]

In this context, $65 oil and $2.50 copper aren't burdens on the economy, they are a measure of just how healthy the economy is. These days, commodity prices are best seen as barometers of economic health. By that measure the global economy is doing very well. Today's FOMC announcement worried that "possible increases in resource utilization, in combination with elevated prices of energy and other commodities, have the potential to add to inflation pressures." If the Fed were to decide that it needs to tighten policy in order to slow the economy and avoid "overheating," the current strength of commodity prices suggests that they would be facing an uphill battle. That would present a serious challenge to the fixed-income market, which has adopted a strong consensus that the Fed will tighten only one, or possibly two more times, to 5 or 5.25%.

27 March 2006

Mail bag

"I was wondering if there is somewhere on your blog that you store your current stock picks with price targets and stops. I know you have mentioned these within your articles - just wondered if there is a summary out there somewhere I missed."
No, as the eBlogger software (this site's template) does not support a format that allows for a fixed placement template that lacks only my regular updates. Nor does it support file uploads (for your download). Moreover, this site's handful of readers seem resolutely disinterested in me emailing items of possible interest, based solely upon items proffered previously. So why create a distinct file? Instead I attempt to regularly update past recommendations via new posts. Of course, this is not helpful for those readers who would like a summary, or track record. If any readers have suggestions or alternatives, including software changes please post as a reply here or email.

There is no magic answer, btw, re stops and objectives, especially if you view investments as I do, as a continuum. I place my trust in Newton's First Law of Motion. "An object at rest tends to stay at rest and an object in motion tends to stay in motion with the same speed and in the same direction unless acted upon by an unbalanced force." An investor need only recognize and align his or her time frame with the appropriate periodicity for the investment. How high (low) is high (low)? How much time is too much time? How long do trends endure?

All of which seques, I suppose, to this reader's questions...
"I don't see a recurring pattern, I don't. I hereby abandon my attempt to come up with a time objective in relation to this triangle pattern. If it is a symmetrical triangle pattern, please tell me what (else) do you see? I'm not requesting that you divine the future and tell me what it will do. I'm not looking for some sort of price guarantee. I'm more interested in as of this moment, what you see, why, what you look (out) for, etc. Too, what it is you saw when you gave me the heads-up about it. All with the understanding that this could all be thrown out Monday am after the market opens. I'm a big boy, David. I just want to learn."
It might seem odd, but I find this reader's questions extraodinarily difficult to answer. For example, how can I tell you what I see, if you cannot tell me what you do not see?

This particular reader is smart, and he has put in the time and effort to become especially savvy re investing. (And, he is a friend.) He communicates well -- certainly, better than my slovenly efforts! -- and yet even with his many talents he proves unable to explain what he sees, or does not see. I know my answers to date have frustrated him, likely seeming coy or evasive. But how precisely to answer such probing questions as his?

He queries about a private investment recommendation I shared less than 1 week ago. (There is no point for this essay to name the specific investment.) In the intervening days, his investment has appreciated by ~5-8%. That number is unimportant because, to my eyes, the shares look set to go higher in the days and weeks ahead. More important is that the shares rise in price from a chart pattern that is not especially clear, at least to many investors. And yet, again, to my eyes, it coheres into a unified whole. Higher in price, much higher, and soon.

On what do I base that assessment? What did I see before it began its breakout (last Friday), that encouraged me to buy amid the seemingly swirling incoherence of random price bars? What is it I see now that encourages me that the shares are going higher in price, higher than his target of +~$2.50 more?

I suppose because I trust, and even have faith, in the continuum and Newton's First Law of Motion. Most people believe there is one right answer -- stop out at this specific price, objective that specific price -- as if the shares and the market simply and ably turn on such dimes. But they don't, and it doesn't. How many times has your stop order filled, only to leave you empty-handed as the shares screamed higher? How many times have you sold, only to watch the shares scream resolutely higher? How many times have you not purchased, awaiting the ideal moment to buy?

The true answer lies within each of us. At what point are we satisfied with the gain, no matter how much higher the shares rise after our sale? At what price, in advance, might we no longer endure the anguish of being wrong, and thus stop out, no matter what the shares do thereafter? And why is it we force the shares to perform 'right' before purchasing, thus likely causing us to miss the (big) move? I contend it is better to embrace uncertainty; to recognize that, despite your best efforts, you will be wrong always. So your efforts are best expended in being wrong in the right time frame. Yours.

This is why your questions re this or that investment, at least of me, should include your time frame, your expectations. To ask simply, "What do you think of XYZ?" results only in GIGO. Better would be, "What do you think of XYZ in this specific and delimited time frame -- higher or lower, and by how much? Is it an appropriate investment for my portfolio?" Which, of course, begs many additional, and typically unasked, questions. The more information shared, the better the answer... well, reply. In a universe lacking absolutes -- Hey, even the speed of light is questioned! -- there is no one right answer. Only relative answers; in investing, relative to your needs, objectives, risk tolerances, hopes and dreams. We each are different; thus these numbers change for us all.

"But wait!", you cry, "What of all the other investors who propound in favor of stops and objectives?" Do not misunderstand, I too favor stops and objectives as they are a crucial aspect of any investing methodology. The difference is that I believe those price levels are generated internally rather than externally. Life continues; so do the investment markets. The continuum. How much more consistent might your portfolio's results be if you were to align your interests with the continuing oscillations of the market itself? Remember, it is those oscillations that create your profits. Which is why I believe it folly to attempt to slice and dice the risk from your portfolio; professional investors manage risk, not try to banish it altogether from their portfolios. (Fodder for a future post, I suppose.) Risk and volatility, near-synonomous words though they might be for the purpose of investing, are only one side of a coin whose obverse side is reward and price moves, both up and down.

Do any of the preceding comments make even an iota of sense? As always, I welcome and appreciate your questions and comments.
-- David M Gordon / The Deipnosophist

24 March 2006

Perfectionism

I receive many requests, both public and private, for my 'read' of a specific chart. What will transpire next, the writers wonder?

But that is so
not the way to consistently successful investing. Have you not tired of me harping on "assuming the risk at the appropriate moment, and then trust that you will do the right thing -- i.e., make the hard decision -- should conditions change adversely"...?

The quest is
perfectionism. Price Headley, responds to this 'issue' with the following essay. I have italicized many specific passages I believe especially pertinent. (Price, if you are reading this post, please forgive me for quoting your essay in full, but it is especially excellent and beneficial for all investors.)


Perils of Perfectionism
March 23, 2006

The desire to be perfect cost me plenty of money in the early days of my trading career. Why? Because a perfectionist cannot take a loss, so small losses can easily turn into bigger losses for the trader who is not able to admit being wrong. Plus the trader will try to book a profit too soon to feel like a winner. Read on below for methods to tame perfectionist tendencies in trading.

"It was never my thinking that made the big money for me. It was my sitting. Got that? My sitting tight... Men who can both be right and sit tight are uncommon. I found this one of the hardest things to learn... It is literally true that millions come easier to a trader after he knows how to trade than hundreds did in the days of his ignorance."
-- Edwin Lefevre,
Reminiscences of a Stock Operator

Why do we let losses ride and cut profits short? Perfectionism tends not to allow traders to take their losses quickly, as they are too concerned about looking good to others and not wanting to admit they are wrong. This leads to the dreaded hope for a return to 'breakeven' to get out without a loss. But does the market care about where you bought the stock? NO! The market is going to go wherever it wants to go, and your job is to see that trend and recognize when you are not in tune with it to get out of such trades.

We all have this tremendous desire to prove ourselves right, when in the markets we should concerned ourselves more with making money than the amount of times we are proved right. This means winning ideas need to be ridden longer than average while losers need to be cut short quickly. Our school training says there is one right answer, while in the markets there are many ways to win.

Perfectionism can not only keep you hanging on to losers too long.
It can also keep you out of the best performing stocks. On stocks that rally sharply, I sometimes have to fight the feeling that I've already missed out on the move. In retrospect, many of these stocks go on to much bigger gains than the initial gain I missed. Traders tend to desire a perfect entry, and this leaves them on the sidelines during major trends. (This last point is critical. How many times have I mentioned it? -- dmg) It is these huge trending trades which carry my portfolio historically, so I have to make sure I am participating in these big moves.

Ironically,
perfectionism does not lead to higher performance nor greater happiness. Perfectionism can destroy your enjoyment of trading. (Another spot-on comment. -- dmg) Focusing on flaws and mistakes depletes energy. This may escalate to panic-like states prior to making the trade, impairing objective performance. At some point perfectionistic standards get set too high, and life is measured in units of accomplishment. The drive to be perfect becomes self-defeating, as the individual often places the intense pressure on himself, which can become crippling. Perfectionists share a belief that perfection is required in order to be accepted by others. The reality is that acceptance cannot be gained through performance or other external factors like money or social approval. Instead, self-acceptance is at the root of happiness. Ultimately you must be the one who must live with yourself, so if others think you're perfect but you yourself are never happy, then perfectionism is not helping you to grow and develop to your fuller potential.

One way to be less perfectionistic is to set one goal and make it process oriented, not focused on the outcome. (Hmm, this too should sound familiar. -- dmg) If you achieve that goal to improve your trading via that goal, you win no matter the outcome. Perfectionists often seek to control uncontrollable factors in a trade (like waiting for all the risk to be out and everything to look perfect, the quality of the fill on the exit especially, hoping or 'willing' a better outcome by doubling down on a loser, and many more). When a trader focuses on these uncontrollables, he is more likely to tighten up and not be able to pull the trigger to exit a losing trade or miss out on a new winner that has moved 'too far.' (Think Google/GOOG, which all the traders were convinced would give them the perfect spot to buy. Repeatedly foiled, including today. -- dmg) By focusing on a process that you can control (say, you will only focus on 5 stocks at a time, or you will work on implementing your entries and exits consistently with a small amount of money to improve your ability to execute trades, or another process-oriented goal), you build confidence in your ability to execute your trading plan.

Based on these perfectionist tendencies, I recommend the following entry strategy for perfectionists. Enter half a position as soon as you see an opportunity that generates at least 3 times the reward for the risk at the current market price, then place the remaining half at your desired 'perfect' entry price. For exits, always place market orders, as the tendency for the perfectionist is to try to get a better exit price with a limit, and then keep missing the exit on the way down.

Phenomenal comments. Of course, those readers who believe they know the Holy Grail of Investing -- typically some arcane aspect of technical analysis -- will someday learn that all their effort was wasted effort; it has meant they never were able to buy, or even less, hold on to, the big winners. Life, after all, must have its winners... and its losers.

As always, I welcome your questions and comments...
-- David M Gordon / The Deipnosophist

22 March 2006

Missing in action

What's missing? Volume.

[click on image to enlarge]

When a stock such as Garmin/GRMN (readers will recall my most recent purchase recommendation several weeks ago at ~$69) a rise in price but without the necessitous volume (NB: areas 3 in chart), then I am gone. Which means in this instance that as the shares near the original trading target of $84-85, I am satisfied with my profit, and sell. I have zero need to capture every last penny of potential gain, especially because price rises without volume at critical inflection points are setups themselves for sudden failure.

But that is a topic for a different post.
-- David M Gordon / The Deipnosphist

21 March 2006

Google Finance unveils today


Published: March 21 2006 05:06

Google launches free financial news website
By Chris Nuttall in San Francisco

Google, the leading internet search engine, will on Tuesday extend its ambitions as a content provider with the launch of Google Finance – a website offering financial data and news.

The free service will be launched in the Google tradition as a still-in-development beta product. But it appears to challenge the well-established Yahoo Finance and Microsoft’s MSN Money for dominance in the sector.

Google Finance offers similar features to its rivals – share quotes and charts, integrated financial news from its Google News service, discussion groups and the ability for investors to create personalised portfolios of their share holdings.

It also introduces innovations. The interactive charts will map market data with news stories, so the effect of announcements can be tracked against the stock performance. The charts can also be dragged dynamically using a scroll bar through different time periods. (I have yet to view this technology, but surmise it is most likely achieved utilizing the programming language, AJAX. This "innovation" of scrolling through different time periods represents a significant and invaluable improvement. -- dmg)

Users can find out information on a company by just typing in its name, rather than having to know its ticker symbol. Google has also adapted its search results page by showing the frequency of news about a company, with bar charts showing news volumes over time. Its Blog Search will add results for online commentary found in blogs.

The company’s entry into aggregating financial information is likely to spark competition and fresh innovation in the sector. Yahoo Finance, the leading service, has made few technical improvements to its site compared to the recent “Web 2.0” innovations it has introduced elsewhere. These include a facelift for its e-mail service to allow drag-and-drop of e-mails and viewing panes for messages.

It has continued to add content and data to Yahoo Finance. Six months ago, it announced it was hiring nine columnists to add original content to the site – its news has been provided by partnerships with a broad range of media outlets, including the Financial Times.

The Google service actually links to its competitors in areas where it lacks expertise – such as Yahoo Finance’s research reports and comparison charts.

“Yahoo has a very strong offering , they’ve been around for 10 years, this is Day One for us so we want to do what’s best for our user,” Katie Jacobs Stanton, senior product manager of Google Finance told the Financial Times.

The new service was developed in Google’s Bangalore and New York offices and its data is largely confined to North American companies. European stock data should be added once licensing deals have been agreed, Google said.

Yahoo Finance holds a big lead globally over MSN Money in the sector and is also number one in the US. The Nielsen//Netratings research firm gave it a unique audience of 12m users in February, compared to 10.9m for MSN Money, 8.5m for CNNMoney and 8.3m for AOL Money and Finance.

Article URL

20 March 2006

Marvelling at the opportunities the market always offers

From Briefing.com comes this précis of a Friedman, Billings, Ramsey research comment re Marvell/MRVL...

FBR views the recent sell off of Marvell/MRVL shares - down 17% since the beginning of March - is significantly over-done. The firm sees the shares as attractively valued trading at roughly 28x their FY07 EPS estimate of $2.01, which implies a near trough level valuation. The firm continues to view Marvell as a core holding for semiconductor investors, with the recent weakness providing a rare window of opportunity for investors to build positions in one of the best performing, premier communication IC companies. In the firm's view, the recent chatter of price-wars in the HDD segment, the push-out of the Sony PS3 game console, and the general seasonal softness in the PC complex, as all weighing unduly on the shares of Marvell. In the firm's view, to be overly negative on the name at this stage misses the positive impact of several key product cycles which are still in the early stages of playing out. The firm reiterates their Outperform rating, while standing by their full-year FY07 EPS estimate of $2.01, and our 12-month price target of $75.
As you know, I too regard highly this specific investment's potential and current opportunity.

[click on image to enlarge]

From the all time high of $73.67 reached on 27 January 2006 (#1), the shares have made a beeline decline (#2) toward gap support (#3) and its resolutely rising, 200 day simple moving average (now at $51). This places Friday's closing trade ~7% above the 200 day sma -- and crucial support; well within the 10% boundary I prefer. Both price and time corrections near their respective exhaustion.

The shares likely will gap higher on today's opening trades due to this 'news', but could also reverse down during the trading day. Nonetheless, I am exceedingly close to purchasing lot #1. If and when I do, I will try to update you via a comment reply to this post.

As always, I welcome your questions and comments...

-- David M Gordon / The Deipnosophist

19 March 2006

Weekend reading roundup for investors

1) The Last Quarter of the Guidance Game
"The recent news that Pfizer is considering walking away from issuing quarterly earnings guidance is only the latest evidence of what may become a sizable exodus. Indeed, the trend of abandoning frequent guidance has been gaining momentum. Just this year, Motorola, Citigroup, and Idexx Laboratories have announced plans to stop providing quarterly guidance. And a handful of companies, including GE and Google, have eschewed guidance altogether."

Continue reading here.

2) "... the Network of the Future..."
Another fascinating commentary from Robert X Cringely re the possibility that satellites solve the bandwidth problem. Continue reading here.


3) This comment re risk is from Dorsey Wright. I quote it in full because it is brief (within the allowed boundaries of quoting three paragraphs allowed as a citation) as well as especially pithy.

"The definitions of risk are many, but few are any good. The most common measurement of risk is standard deviation. It is a statistical measure of the dispersion of returns around the mean value whereby a larger variance or standard deviation indicates greater dispersion. The idea is that the more disperse the expected returns, the greater the uncertainty of those returns in any future period. It is another way of addressing the volatility of the returns. The word volatility causes many investors to run for cover, but to the trend follower, volatility is the precursor to profit. If there is no volatility there is no profit. Therefore, simply observing that a strategy has a relatively high standard deviation, without further examination, is meaningless. A measure that only considers deviations below the mean is the semivariance. That is a measure much more useful to investors because few are bothered by volatility when it is manifested in positive returns above some target rate. Investors are concerned about minimizing the damage. Of course, investors would prefer no damage (ever) and all outperformance. Unfortunately, trend followers require volatility to generate profits, and drawdowns are an inevitable part of a trend following approach. A key selling point of a systematic trend-following approach is that trend followers have greater upside volatility and less downside volatility than traditional equity indices such as the S&P, because they exit their losing trades quickly. This results in many small losses, and large long-term gains that result from staying on winning trends.

"Furthermore, risk cannot be eliminated or even minimized. It can only be managed or shifted. If one tries to eliminate the risk of a drawdown, the risk of not generating enough profits to meet one’s financial goals is the result. (emphasis mine -- dmg) The fear of drawdowns should be secondary to the fear of not following a proven strategy. Of course, any strategy must take into consideration the effect the volatility will have on the investor. As investment professionals, we have a very important responsibility to educate our clients up front about what they can expect from an investment strategy. Also, a strategy that generates phenomenal long-term results, but does so while scaring the investor to death is no good. A balance must be struck between a strategy that generates high returns and a strategy that allows the investor to stay in long enough to reap the benefits...

"A proper evaluation of risk involves weighing the probabilities of the various outcomes. It also involves the realization that where there is no risk, there is no reward. Adhering to a proven trend-following approach gives the investor a very high probability of positive outcomes over time. Our goal is to manage risk, and allow volatility to work in our favor over time.
"


4) This next item is an excellent definition of VWAP. Moreover, its embedded example is excellent and crucial, as it shows that not all investors invest with simple directional, arbitrage, or hedging strategies. The comment comes from an Internet group (of which I am a reader) that has as its participants many insightful investors; it might be best of breed. Unfortunately the writer is anonymous, so I am unable to attribute properly his or her comments. (Readers of my newsletter might recall my feeble attempt to define VWAP. If you would like a copy of that specific issue, please email your request to davidmgordon@gmail.com.)

"... I expect you know about Value-Weighted Average Price(VWAP), but for those reading this post who don't let me give a quick summary of the way thebig houses execute bulk trades on behalf of the fund world:

"Having secured a large order from a big investor, say a Fidelity fund, the broker (Goldman, UBS, Morgan, etc) is paid a nominal commission of 1 to 2 cents per share and then encouraged to spread the orders out over the course of the day by splitting (usually 40% to the broker) any improvement over the trade weighted average price of the day withthe investor. For example, if at the end of the day the trade weighted price (take each price times the volume at that price divided by the shares traded that day) was $50 and the execution price was $49.75,the customer will pay the broker dealer an extra 10 cents a share($.25 x 40%).

"It is obvious that the broker dealer is greatly incented to beat the VWAP and they have figured out how to maximize this. When they get alarge order, especially one where the amount is larger than a good percentage of the average daily volume (this allows them to control price), they buy a little in the morning and throughout the day, but save a good portion of the trade for the end. This statistically givesthem the best chance of driving up the price of the stock at high volume, creating a higher VWAP than would otherwise be the case: the higher the VWAP, the greater the chance for the spread over actual execution.

"When money is coming into the market, most if not all of these VWAP programs are buy programs. This is why you see buying in the morning,then a stall, and then buying into the close. When money is leavingthe market, the action is more or less the converse.

"Now to the rhetorical question. Do you really think that Goldman's traders are blissfully ignorant of what their own VWAP desks are doingon the day? Or for that matter what the UBS desks are doing? As fortheir asset managers, well, perhaps I am revealing too much about myown inner Gordon Gecko but were I in such a job I'd have turned anyChinese wall into Swiss cheese long ago. And if the SEC came calling I'd blame the termites.
"

As always, I welcome your thoughts on any of the above comments.

-- David M Gordon / The Deipnosophist

17 March 2006

Attelet

Okay, despite the many examples readers provided of the described intermediate term base I am left feeling under-nourished. But then I am a glutton anyway! So let's try this again...

Thanks to reader, Marty Safir, for the heads-up re BBSI in October 2005.
When Marty had requested my opinion, I quickly noted how high the shares had risen, and in a comparatively brief period of time (to $29 from $2!) almost without hesitation. Certainly, the shares were due for a correction.

[click on image to enlarge]

(Let's zoom in on area 1...)

[click image to enlarge]

And a correction is precisely what has occurred since its intra-day reversal on 11.3.05 (#1). But note how the low (#2) of the presumed base, at least the low so far, comes three months later -- almost to the day (2.10.06). A huge reversal occurred on that day, bouncing off the crucial support represented by the 200 day sma on massive volume and closing on the high trade of the day. This occurred because the company reported the evening prior net income of $4.3 million for the fourth quarter ended December 31, 2005, an improvement of approximately $1.8 million or 72% over net income of $2.5 million for the fourth quarter of 2004. Diluted earnings per share for the 2005 fourth quarter were $.37, as compared to diluted earnings per share of $.27 for the same quarter a year ago. For 2005, diluted earnings per share were $1.21, as compared to $.79 for 2004. Net revenues for the fourth quarter ended December 31, 2005 totaled $58.0 million, an increase of approximately $6.0 million or 11.5% over the $52.0 million for the same quarter in 2004. For 2005, net revenues were $231.4 million, an increase of approximately $36.4 million or 18.7% over 2004.

Moreover, positive guidance was shared with respect to its operating results for the first quarter ending March 31, 2006. The Company expects gross revenues for the first quarter of 2006 to range from $232 million to $234 million, an increase of approximately 48% over the first quarter of 2005, and anticipates diluted earnings per share for the first quarter of 2006 to range from $.10 to $.12 per share. This range of expected earnings per share equates to an approximate increase in net income of 39% over the first quarter of 2005.

(Barrett Business Services/BBSI principal activity is to provide staffing and professional employer services. It provides a range of services and expertise in human resource management encompasses five major categories. It includes payroll processing, employee benefits and administration, worker's compensation coverage, effective risk management and workplace safety programs and human resource administration. It includes functions like recruiting, interviewing, drug testing, hiring, placement, training and regulatory compliance. It operates through a network of 30 branch offices in Washington, Oregon, Idaho, California, Arizona, Maryland, Delaware and North Carolina. The customers of the company include electronics manufacturers, light-manufacturing industries, agriculture-based companies, transportation and shipping enterprises, food processing, telecommunications, public utilities and professional service firms.)

Having risen in price by ~1300% (is that calculation correct?), is the worst of the price decline to be only ~$8, or ~27% (from the high)? Yes, if this proves to be a correction of time rather than price.

This means the upside breakout should occur between now and mid-May (to complete the 6 month intermediate term base, and to set up the Upside Squueze). Because that possible breakout could occur within the next 8 weeks, I move it up to the list of stocks nearing their inflection points. And, because it is unlikely the shares will again pull back to ~$21, the inflection point I seek would be the upside breakout. A trend line of declining tops identifies a spot immediately above $26. Because its trend is gently lower, it will still be $26 many weeks from now.

If and when that eventuality occurs, volume should expand explosively. I would expect the shares to rally strongly to the upper-20s (or low 30s) before hesitating for 1-3 weeks, as it builds its handle. Yes, this base of the past 4½ months is a picture perfect cup (of the afore-mentioned cup & handle pattern). How ever did you all miss it? :-)

Questions and comments welcome.

-- David M Gordon / The Deipnosophist

Next Generation Search

Bill Burnham's comments...
The search industry has been dominated for the last 6 years or so by one significant technology, Google’s Page Rank . Page Rank basically uses popularity as a proxy for relevancy which, if Google’s $100BN market cap is any guide, has proven to be a valuable approximation. However like many technologies, Page Rank’s hegemony is gradually wearing thin thanks to the fact that it is easily gamed and inherently limited by its derived and agnostic nature. With Page Rank’s utility declining thanks to SEO companies and “site spam” the natural question becomes what, if any, new technologies will emerge to either supplement or even replace Page Rank.
Continue reading here...

-- David M Gordon / The Deipnosophist

It has to be me...

RobotMan by Jim Meddick

[click on image to enlarge]

-- David M Gordon / The Deipnosophist

15 March 2006

Time is of the essence

Okay, this has been a difficult week -- and it is only early-Wednesday morning as I type! Monday afternoon brought with it a complete waste of (too) many hours at the office of an ophthamologist. I had considered writing a post about that escapade, but I found it difficult to restrain my venom. Yes, I was that angry. Then yesterday, I simply could not access e-blogger; neither to post nor to comment. Alas, those problems continue this morning, inhibiting my ability to write this post. (Allan, did you have any difficulty?) I had hoped to write and post this commentary yesterday. But here it is, finally; perhaps shortened somewhat to allow for the imminent opening of today's markets. I hope its clarity is better than prior attempts.

Many readers have requested another, (but better) explanation of the time & price continuum. I have an investing maxim (thanks,
Bob Koppel!) that states, "
Focus on the process, not on the result." So that is precisely what I hope to accomplish with this post: limn a specific pattern, its process, its rules, its expectations, and then point to current opportunities quietly building the same pattern.

Let's consider Apple Computer/AAPL. I have highlighted many distinct points on the chart (below)...


[click on image to enlarge]

1) The reversal day that serves to end the preceding up trend;
2
) The reversal day that serves to end the preceding down trend (readers will recall me mentioning same during that day);
3) The intermediate term base, which endures for almost precisely six months and manifests as a cup (of a cup & handle pattern);
4) The breakout from the base into new all time highs;

5a) The handle (of the cup & handle pattern). Note its duration (~3 weeks), and
5b) Its diminution of volume;

6) The new up trend. (NB: its duration!);
7) The critical reversal that demarcates the end of that up trend.

And then the clock begins once again to tick anew ...

8) Critical (and long-ago forecasted) support at $63-62 has so far arrested deeper declines. In fact, these two lows represent a possible and potential double bottom;
9) Which would become a confirmed double bottom with a trade above the intervening high at $73
10) Before that occurs, however, AAPL shares must successfully breach (and close above) important resistance, the correctly identified trend line of declining tops, now at ~$67.50 (but round it up to $68 to factor in Point & Figure analysis); critical resistance lies above at ~71.6 - $73, which represents a Fibonacci retracement of the decline, the 50-day simple moving average (sma), in addition to the afore-mentioned $73 to confirm the possible double bottom.
11) If $62.50 proves to be the low end of the decline, then it sets up as comparatively shallow. Thus, this correction could be one more of time rather than price (despite the ~$25 decline from the high trade). Figure three months as a minimum and approximately six months as ideal.

Other examples of this type of pattern (and thus, opportunity) include but are not limited to,
Best Buy/BBY: emerging now from the handle (of a c&h pattern) but requires a substantial expansion of volume;
Garmin/GRMN: Building now its handle, from which it could emerge any day within the next 2 weeks, including today;
Intuitive Surgical/ISRG: Just tagged low #1 of a possible, probable double bottom, intermediate term base, bouncing off of critical support, the 200 day sma;
Marvell Technology/MRVL: Very shallow decline, as it heads for its first low of the pattern;
SanDisk/SNDK: Very near in both price and time to its first low trade and upside reversal.

Similar setups, although not at all the same include...
Google/GOOG: Breached critical support (200 day sma) but came screaming back on the news re the DoJ. Plenty of price resistance above as this pattern heals itself -- if it heals. (I re-purchased aggressively upon the sudden reversal in price and before I knew the news. Lacking immediate follow-through means I will not hold for long purchases made yesterday.)
Salesforce.com/CRM: Not yet clear how this pattern will build, but it is possible it will endure for only three rather than six months before moving to new highs;
Teva Pharmaceutical/TEVA: Extraordinarily shallow decline (~$46 to $40), this probable base will likely prove to be one of time (and enduring ~6 months; thus, watch for its breakout between mid-April and mid-June).. and move higher explosively.

Two specific rules apply to the double bottom, intermediate term base...
• Typically, and assuming the pattern is a base and not a top, at least one of the two lows will tag the 200-day sma; if the first, that low will be deeper than the second low, if the second low, then that low will be higher than the first low. This occurs because the 200 day sma moves resolutely higher during a long term uptrend. I attempt to purchase within 10% of the presumed low.
• The base is typically six months because that is the disparity between the two simple moving averages, the 50 and 200 day. This then sets up the Gordon Upside Squeeze (for my long term readers).

The question thus becomes, "What do you think of this or that stock in (blank) time frame?" rather than, "What do you think of this stock?" Anyone could buy at any point along the continuum, albeit at inflection points. For example, consider again TEVA. It has all the hallmarks of a base rather than a top, and it is not guaranteed to endure as long as it could and might. So I am happy to accumulate as close as possible to $40 awaiting the presumed coming breakout at $46. But you could purchase the breakout, as the difference will scale to insignificance when the final high is registered.

There is no particular magic to this pattern, nor is it the Holy Grail of technical analysis (especially because it includes many different aspects of that discipline). I favor it however, because it affords me the opportunity to purchase an investment the market clearly desires but at a moment -- well, at any one of many different and varying moments -- of substantially reduced risk and maximum upside reward. An intermediate term base within a long term uptrend. Consider again Intuitive Surgical/ISRG. Some investor, some many investors, finally threw in the towel and purchased in the $130s. But why? Trend analysis -- an altogether different topic (and post) -- would indicate the tiring, and about-to-expire, trend prefatory to this intermediate term base pattern. For that eventuality, patience is its own reward.

I hope this explanation helps you to see better this pattern, and how the two axes, when used together, combine for a formidable setup. Can you point out other examples...? Please post them here as a comment reply.

Trade well, be well,
-- David M Gordon / The Deipnosophist

12 March 2006

The Strip, by day and by night, inside and out

"The Strip" in Las Vegas has undergone a tremendous number of changes recently; in fact, it is amost unrecognizable, if your last visit was some years ago. What follows are several images to whet (perhaps) your appetite for even more, albeit seen up close and personal. (Click on each image to view an enlargement.)

Angels herald your arrival at Caesar's Palace...


Venetian (or is it Murano?) glass adorns the ceilings throughout the Bellagio. (This photo is from the registration lobby.)


Gondoliers ply the canals at the Venetian...


The Strip at night, looking past the Imperial Palace (soon be torn down for another theme park of a hotel) and Bally's to the Eiffel Tower at Hotel Paris...

Cars whiz by...

I go to all extremes (and angles) to capture the perfect snapshot!

10 March 2006

Two photos of the sub-Arctic

One reader, Ed Hausladen, equally impressed by the photo of "Sunset at the North Pole" but also disbelieving of its validity, forwards two photos of his own. I am in a state of agape -- wow!
-- David M Gordon / The Deipnosophist
~~~~~~~~~~~~~~~~~~~~~~~~~~
"Here's a subarctic photo for you that's not retouched or manipulated. I took it in 1989 while in the Navy and stationed in Iceland. The subjects are the aurora borealis, a ruin, and the (overexposed) moon rising over a frozen lake. (We may see the aurora here in the lower 48 in a few years when the solar magnetic storm cycle peaks.)


The second photo is the same lake, same ruin. This time the lake is unfrozen and reflects the aurora.

Sunset at the North Pole

[click on image to enlarge]
Geez, but isn't this photo phenomenal? I suppose the image was photoshopped, but still a fellow can dream, eh?

Jobs market -- steady but unspectacular gains

The following comments are from Scott Grannis, the always-insightful Chief Economist at Western Asset management.
-- David M Gordon / The Deipnosophist


The U.S. economy has been creating jobs at about a 1.7% annual pace for more than two years, and there is no sign that things are changing. It's not as exciting as the late 1990s, when jobs grew by 2.5% per year for four years, but jobs today are growing a bit faster than the labor force, so the unemployment rate should inch down a bit further as the year progresses, despite the slight uptick from 4.7% to 4.8% in February.

It's reassurring that this growth in jobs has very little to do with government spending, since government payrolls have been rising by less than 1% a year for the past three years. This contrasts notably to the 2-3% annual growth in government payrolls in the 1999-2000 period.

As the labor market gradually tightens, hourly earnings have been rising a bit faster. Earnings were up 3.5% in the 12 months ended February, the fastest pace since 2001, and almost as fast as the 3.5-4% pace of the booming 1997-2000 period.

All this paints a picture of an economy that is healthy but not booming and a labor market that is very gradually tightening but not on fire. With the housing market gradually slowing down, the market is envisioning a "soft landing" scenario in which growth and labor market conditions settle into a somewhat slower, but steady-state pace by late summer, prompting the Fed to conclude that a 5% funds rate is sufficient to keep inflation and the economy under control for the foreseeable future. In short, from the looks of things today, we are only 50 bps away from Fed funds nirvana.

Volatility is extremely low

Scott Grannis re stocks and bonds volatility...

The economy has been growing at a moderate pace for 10 quarters. The Fed has been tightening in a well-publicized and nonthreatening manner for the first time ever. The labor market has been growing at a steady, moderate pace for two years and tightening ever so gradually. The economy has weathered $65 oil, $3 gasoline, and $14 natural gas without skipping a beat. The bond market has enjoyed the longest period of relatively stable bond yields since the early 1960s. Corporate profits have been very strong for over four years. The global economy has been in good shape for years, emerging market economies are once again prosperous, and Japan has finally broken out of its deflationary funk. Outside of GM and Ford, there have been no nasty surprises to rock the markets since 2002. On balance, the economy has been stronger than expected, the news has been better than expected, and a "soft landing" scenario seems plausible and within reach.


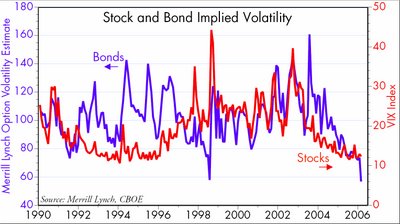
The flat yield curve says that the Fed will stop tightening soon and interest rates will be just south of 5% for as far as the eye can see. And the fact that implied volatility in bond options is as low as it has ever been in recorded history (which, by the measure used in the chart, goes back to 1988) means that the market is very confident that not much is ever going to happen to any of the major economic and financial market variables.

[click image to enlarge]

The last time volatility was this low in the bond market was just before the Russia/LTCM crisis in the summer of 1998. Low volatility and high confidence lead some to take riskier and riskier positions. If the future doesn't turn out to be as placid as expected, these positions can cause much pain and suffering, and unwinding them can cause prices to gyrate as volatility spikes. Recall the bloodbath in the second half of 1998. Whether another such unpleasant event is just around the corner is hard to say, but the market is exceptionally vulnerable to the unexpected at this juncture. (Italics mine -- dmg)

What could go wrong? The housing market could unwind too fast, pulling the economy down with it. Or the economy might just keep barrelling along, spooking the Fed into raising rates by much more than expected. Core inflation might start picking up. A weaker housing market, and weaker economy, and rising inflation might go hand in hand, since lower home prices could result in rising rental prices, and rents comprise almost one-third of the the CPI. This would be a particularly troubling combination of events, since the Fed would be in a very tough position: should they ease to cushion the economy, or should they tighten to arrest inflation? Whatever the case, when markets are as relaxed as they are now, it's time to start getting nervous.

Smart Money Management

It would be difficult for me to improve on Price Headley's intelligent comments re money management. And his essay is sufficiently brief that I can post it here rather than a link. But do check out his site; gobs of excellent material are to be found therein.
-- David M Gordon / The Deipnosophist
~~~~~~~~~~~~~~~~~~~~~~~~~~~~~~~

Most traders put their emphasis on determining the best entry and exit points, but smart traders also consider how their money management rules will affect their performance. Money management is probably the most overlooked area in trading and investing. Here are some questions to answer as you determine the most effective money management plan:

1) How much capital will you need to invest effectively? In today's markets, you should have at least $10,000, and preferably $20,000 or more in risk capital to trade. If you try to trade with less capital, the economies of scale diminish. For example if you traded once per day at $20 round trip in commissions, that's $5,000 in 250 trading days, or one year; so right away a $10,000 account needs to make 50% to cover these fees, while a $100,000 account needs to make just 5% to cover these commission costs. You should also factor in any other costs you incur to trade, such as quote vendors, trading software and computers, if dedicated. You can see that the more you invest on the front end, the bigger your account should be to make back these costs more easily.

2) What percentage of your capital will you invest in each trade? The amount of capital I typically use is 10% per trade in my own accounts. I know traders who commit anywhere from 5% of their account per trade to 20% of their account per trade. But the bottom line is what you are truly willing to RISK of the amount you invest. If I invest 10% of my equity for an options program, I only want to take a 20% loss as I seek not to risk more than 2% of my total account equity on any losing positions. I generally prefer not risking more than 1% of my total account equity on a losing trade, which would require a maximum 10% loss when investing 10% of my capital in a new trade.

The Kelly formula shows another way to determine the optimal percentage of capital to risk per trade, which is:

Kelly % = W - (1-W) / V
W = Winning Percentage
(1-W) = Losing Percentage
V = Average Winning Trade / Average Losing Trade
If W = 60%
If average winning trade = 500
If average losing trade = 250
Then Kelly % would = 40%
The Kelly formula suffers from a drawback in that it assumes all profits and losses are equal, which is not the case. However, it can help a trader get an approximate assessment of the percentage to invest once you know your system's winning percentage and the size of its average winner and average loser.


3) Are you at risk of committing too much to each trade? Most traders tend to overcommit their capital allocation per trade, and then go through an inevitable drawdown which knocks both their financial capital and takes their emotional capital out of the game. If you have a 50% winning percentage, odds are that you will see two losers in a row 25% of the time. If you are committing 20% of your capital per trade in an options portfolio with no risk control, you could experience a 60% drawdown in your capital which would likely knock you out of the game. Low winning percentage systems are not necessarily bad, especially when the size of the average winner is many times greater than the size of the average loser. But some traders may not be psychologically equipped to ride out the higher volatility that can come with a lower winning percentage. The best way to address this is start out more conservatively than you think you need to until you get comfortable with a method's upside and downside (general rule of thumb: cut your normal allocation per trade by half when you first get started).

4) How many positions will you focus on at one time? I recommend you trade only a handful of stocks at any one time. I like to concentrate my portfolio in my best ideas, plus I like to stay focused on how each stock is acting. If my portfolio is too big (I'd say more than 10 stocks is too many to focus on, and I prefer to keep my open positions at 7 or less per dedicated portfolio), then I will lose focus and invariably miss an exit on a trade that I should have previously exited. When looking for new opportunities, I use computers to boil down thousands of stocks to ultimately the top three stocks or options I want to add to my portfolio at pre-defined levels on any given day. If my systems still leave me too many stocks and too many factors to look at, I will be unable to keep up with information overload. This will leave my mind overwhelmed, which will lead to an inability to pull the trigger, also known as "analysis paralysis."

Famous analyst, Richard Wyckoff suggested to look for signals that you might need a break from trading:

"The first is a technical warning - the situation in which your analysis gives unclear, confused signals. The other two are emotional - relying on 'instinct' rather than research and a growing or chronic indecisiveness about executing trades."
Stay focused on a small number of top-performing stocks as an antidote to avoid burn out from information overload.

09 March 2006

Charting the World's Oil

This site includes an excellent visual representation of global oil flows. And offers an almost interactive experience. ("Almost" because its offered questions are canned.)

-- David M Gordon / The Deipnosophist

08 March 2006

Killing Rain

Barry Eisler, successful author and all-around nice guy, continues to amaze readers with his series of thrillers that feature the assassin, John Rain. This blog's readers already know how much of a fan I am of these novels. Now comes this review, from London's The ECONOMIST...

New thrillers
Local hero
Mar 2nd 2006

From The Economist print edition


ESPIONAGE thrillers look simple to cook up—international politics, shadowy spy agencies, super-fit heroes and athletic sex offer an easy recipe—but few authors get anything close to providing a gourmet meal. Fewer still can create characters that endure and develop from book to book, and avoid the ghetto of a single arena of national or regional intrigue. One that increasingly looks like bucking the trend is Barry Eisler.

The first two books that featured Mr Eisler's Japanese-American assassin-hero, John Rain, “Rain Fall” (2002) and “Hard Rain” (2003) were written with a delightfully soft touch and a powerful blend of excitement, exotica and what (ever since John le Carré) readers have known to call tradecraft. But they were likely to appeal mostly to those who know or are intrigued by Japan, for that is where they were based.

With two leaps, however, Mr Eisler has broken free. In “Rain Storm” (2004) both the hero and the villains discovered globalisation. The action moved to South-East Asia, Hong Kong and Brazil, while the protagonists broadened to encompass Mossad, al-Qaeda, arms dealers and sundry shady Saudis, as well of course as the CIA. And now in “Killing Rain” the dramatis personae are similarly broad, while the main locations are Hong Kong and the Philippines. Few readers will be able to visit the men's toilets in Hong Kong's China Club without a nervous backwards glance at the maintenance door, from behind which Mr Rain emerges for one of his killings.

Mr Eisler has managed to pull off two further tricks, in addition to escaping the Japanese trap. One is to make the tradecraft convincing rather than simply gadget-ridden or exotic, and to make the organisations and people practising it feel believable. In this he has an advantage: just as Mr le Carré spent some time in Britain's MI6, so Mr Eisler served for three years in the CIA. The second trick is to make his hero's thoughts almost as interesting as his actions, thus providing a more balanced and satisfying read: Mr Rain is a paid killer with a conscience, always questioning his own motives and morals, trying to work out which are the good guys and which the bad, so that he is on the right side. He is also increasingly preoccupied with retirement, which means eluding all the agencies he has worked for or against. This reviewer, at least, hopes that Mr Rain will put off quitting for a while."

Killing Rain
By Barry Eisler
Putnam; 352 pages; $24.95
Published in Britain as “One Last Kill” £12.99


What this reviewer seems not to know is that book 5 of the series, The Last Assassin, is available at bookstores everywhere on 1 June. And that book 6 might culminate the adventures of John Rain.

Help me out here; if you have read the books, what do you think of them...?


-- David M Gordon / The Deipnosophist

Shedding more light on the darkling plain

After many promises, I did finally write "On a darkling plain." What has troubled me ever since posting it is that in the end it proved deficient to my objective. So I asked my friend, Jiminy Cricket, what he thinks of the post. He stood on my shoulder, and whispered in my ear the following...

Basically, your "Darkling Plain" post is the best description of yours I've read yet to address the way you think about time. That's the good part, and why I complimented you on it. Yet it lacks what I'd call "the hard stuff" that would make it really actionable to readers who might want to rely upon it to pick stocks: Namely how to think about bases. Not ALL bases ultimately yield to breakouts. Some look like they're basing for a while and then break down, sometimes massively. And it's not as simple as saying, buy the low points in the base, and then if it breaks down you won't get hurt too badly. For we (or least most of us) have great difficulty analyzing where that low is. It might look like it's plateauing at a certain level only to ultimately establish a lower base later leaving one with substantial losses if they accumulate a large number of shares, and confronting the uncomfortable choice of holding and hoping for improvement or taking losses only to perhaps later see the shares recover and breakout.

As I've said to you before (I think you posted my last comments on this topic not too long ago) it is this that has so many people focusing on breakouts. They may offer less upside but they tend to be clear and unambiguous and good percentage of them go higher (at least in good market conditions). I know you've addressed such topics before in your newsletter and other places, but it's always remained opaque (not so much in theory as in practice.)

Perhaps with the added clarity and succinctness that your blog seems to have engendered you might try your hand at this topic again. Here are some topics to consider:
• What are the ways to recognize when a base is merely a resting period and not a prelude to a breakdown.
• How does one manage purchases to manage risk.
• How to know at what point in the base is the proper points to purchase.
• How to limit losses if wrong and how to recognize that you were wrong before getting hurt too bad.


Thank you for sharing your comments, Jiminy. Each of your assessments is correct... however, each also focuses on only one perception, the y axis (price). Why focus on solely the up & down movements of price to the exclusion of the left to right movement of time?

For example, consider Corning/GLW. Last Wednesday, it "broke out" (above $25) and quickly ran to $27.35. It dropped today as low as $25.47, a mere smidgen above its breakout. Please tell me: what happens next? The price breakout has occurred -- now what? Or consider Garmin/GRMN. It too broke out -- on its scheduled day, no less! -- to $76.70 from its breakout at ~$70. But today, the share price dipped all the way down to $72.50! Will today's low represent the low? How could it build a 5 month base, and then its upward move is so de minimis? (At least so far; in fact, the last base 'counts' to ~$85.) Here is one reason why: after any breakout, prices consolidate. That is, they run (up or down) only so far, and then hesitate and build an area pattern of some sort and of some duration. These patterns fill the chart, as explicated previously.
Know how far these breakouts typically run in price before reversing (different percentage moves for NYSE vs NASDAQ stocks);
Know how deeply in price the immediately subsequent counter-move will plumb;
Know how long in time the immediately subsequent base will endure;
Etc.

These bullet points add up to so much nonsense, especially the longer your investing time frame. In the end, technical analysis is both critical and folly. Garmin/GRMN built an 8 month base, broke out at $60, and then quickly rose to all of $70 ($10, or 15%) before building yet another base, this one of 5 months duration between $70 and $55. I would bet you believed (in this or a similar breakout) that the uptrend that ensued from such a nice base would carry higher in price and endure for more time than one or two weeks. So what help was that breakout? What certainty did it provide? What guarantee did it offer? How did it guide you? How do you (or even I) know that from $76.70, GRMN will not build yet another multi-months base?

In addition, bases occur in all trends, up, down, and sideways; what differs is time frame. In an up trend, for example, if a stock rallies in price to $30 from $20, and then trades sideways for several weeks between say, $26 and $30, isn't that too a base even though it transpires within an uptrend?

IF, however, you want to isolate and trade breakouts for the resulting one-way short term volatility only, then recognize that what you buy (or sell short) is volatility; neither trend nor time. In that instance, price, volume, patterns, and trend mean little except within the narrowest of intra-day periodicities. remember the role of faith in investing: the more faith an investor has, the less certainty he or she requires. And, in all likelihood, he or she grants a greater investing time frame.

There are, of course, subtle clues that provide at least one form of answer your questions; I have shared them here and will continue to do so. There is no one "proper point to enter purchases" because your time frame, risk tolerance, and objectives differ from his, hers... and mine. For example, one person is happy trading the $340-$400 range for Google/GOOG, whereas another investor patiently accumulates at $340 and another patiently awaits the breakout at $400 in the hope of adding a measure of certainty to the purchase.

But at what cost? Consider Qualcomm/QCOM in late-March 2000: after the sudden drop to ~$53 from $100 and several months of presumed basing, the shares "broke out" above ~$75 and 'ran' to ~$81.... before plummeting to under $50 (and lower). Tell me again of the 'certainty' that breakouts offer.

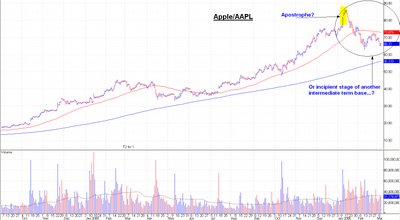
There are movements, patterns, setups of both price and time that speak to me; these patterns serve to encourage or caution. They are not infallible; nothing is. (And certainly not me.) One that I see often is what I term with the self-descriptive, "apostrophe" and "comma"; they appear precisely as they sound. The comma comes at the end of a long term down trend and an apostrophe at the tail end of a long term up trend. For example, is that an apostrophe in Apple/AAPL...?

[click image to enlarge]

It sure appears that way to me. However, I prefer to retain a bullish perspective re this opportunity, so will continue to assume that the shares are busily building another intermediate term base with the low trade somewhere between $62-57. Obviously, that low has yet to be plumbed because this "decline" has been one more of time than price. At least, so far. As readers know, I sold Apple/AAPL at $85+; since then, I patiently bide my time awaiting the presumed low of the base when I will re-purchase. Or sufficient lapsed time, because both bases and tops do not require obvious price swings, as measured in amplitude.

I weave into a tapestry the separate threads of my expectation for the markets, specific stocks, and inter-market relationships. What I see for the intermediate term is not pretty. The market looks set(up) for a rocky (read, down in price) period (read, time; specifically several months with plenty of upside volatility in the short term). I have found that pretty, well-formed, picture-perfect bases do not in fact form in this type of expected market condition. So my portfolio becomes defensive; I prefer to miss the opportunity than to lose money. Investing is one half making money, one half not losing money. For example, presumed critical support for Google/GOOG (~$340) might not hold, so I sold recently (at $390) all lots purchased above $300. When it comes to Google/GOOG, call me a perma-bull if you prefer, but never a fool; I recognize risk when I see it.

Although at first glance it might seem I did not specifically respond to Jiminy's questions, I nonetheless believe the answers are included herein -- albeit in my typical round-about, logorrheic manner. If you remain unclear on any issue, PLEASE ASK.

-- David M Gordon / The Deipnosophist

07 March 2006

Very impressive!

Consider that most jugglers stand stock still as they juggle; doing so means only the items they juggle move thus enabling their eyes to track better the juggled items. Now consider a juggler who moves at the same time as the items he or she juggles, and you have a parallel for investing...

Or consider this video of Chris Bliss in astonishing action. A syncopated rhythm of a different sort.

California Housing Market

This forwarded message is from Scott Grannis, Chief Economist at Western Asset Management...

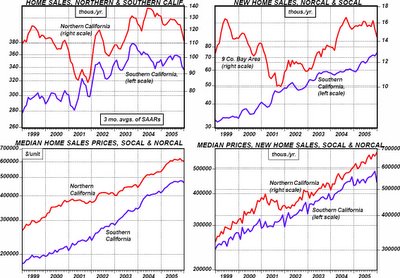
A colleague of mine put together the attached charts using data from Dataquick. Evidence of a top in housing sure is accumulating, but it's still not a slam-dunk. His comments:

"The California housing market has headed down in a big way since about Sep/Oct.

"The last page of charts are perhaps more interesting than first. They suggest that slowdown began in Central Valley first, which is ironic/resonant, since state housing speculation had spread to the CenVal in 2003 and 2004, when builders and speculators ran out of "low-cost" locales on coast.

"Anyway, CenVal home sales are off about 30% in last three months. Condo sales are plunging across the state, and prices on the coast MAY be beginning to ease off (sales volumes certainly are, although new home sales had remained strong up until last month or so)."

[click image to enlarge]

04 March 2006

You owe it to yourself

Having lived near, and worked in, Hollywood, one grows used to seeing talented people on an everyday basis. But every once in a while, someone comes along who blows you away; he or she is that good. Last night I enjoyed the distinct pleasure of listening to the incredibly multi-talented singer-songwriter, Coles Whalen.

But that term (singer-songwriter) fails to do justice to her talent. Coles sings like a seraphim; her exceedingly expressive voice ranges several octaves and styles -- from whispery chanteuse to jazzy torch to gritty rock & roll. Too, Coles is a phenomenal keyboardist and guitarist, playing each instrument superbly while showing no favoritism to either. And Coles writes lyrics like a dream come true; varying from intimate confessional to overt storytelling. She displays great presence, with nary a sign of stage fright, interacting extraordinarily well with her audience. In other words, she is a true, accomplished professional. But here's the kicker: Coles is only 25!

Coles is busy touring the Western US for the next 2-3 months, playing at local bookstores (primarily BORDERs) and coffee-houses. (Truly, I find it difficult to comprehend that talent such as Coles' can be found playing at venues such as these -- but then we each begin our career from its starting blocks.) In July, she begins touring the eastern US. You owe it to yourself to see this exceedingly magnificent and talented artist -- and nice person. Hurry, while there is no cost to see an artist who, in all likelihood, will be top-lining shows on the international tour circuit.

This link directs you to Coles' website, and reveals, among many riches, a calendar listing of her upcoming shows.

03 March 2006

Japanese deflation - end of an era

The following guest commentary is from Scott Grannis, Chief Economist at Western Asset Management...

-- David M Gordon / The Deipnosophist

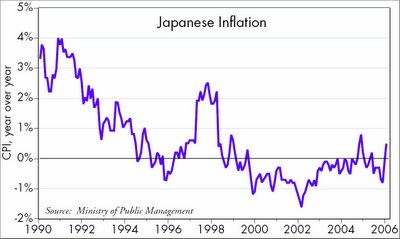
Japanese deflation has been vanquished. Japan's CPI rose 0.5% in the 12 months ended January, a testimony to the power of monetary policy to end even apparently intractable deflation. At the root of Japan's deflation was the Bank of Japan's massive monetary tightening which first became evident when the yen soared against the dollar, rising from 250 in 1985 to 120 by late 1987. It was also reflected in the yen's huge appreciation relative to gold, with yen gold prices plunging from 70,000 yen/oz. in 1987 to 30,000/oz. in 2000. As a result of tight monetary policy from 1988 to 2000, Japanese bank reserves were unchanged for 13 years, putting its economy on a what was effectively a starvation monetary diet.

The BoJ didn't get serious about ending deflation until 2001. "Quantitative easing" then force-fed money into the banking system, with the result that bank reserves skyrocketed 500% from 2001 to 2004. With the typical lags from policy to the economy, it took a few years for expansive monetary policy to take effect, but it is now finally working to push prices higher.

Bond yields are almost certain to rise significantly from current levels, and the BoJ is equally likely to raise its policy rate substantially above zero in the next year or two. Whether the BoJ formally ends quantitative easing in the next month or two is not really as important as the fact that it has accomplished its goal. Higher interest rates are almost inevitable, but they will not be bad news for the economy, and could even help to stimulate it. Rising yields are ultimately driven by a rising price level, and the end of deflation removes one of the sources of Japan's chronically sluggish growth by encouraging consumers to spend their money instead of hoarding it.

Japan's industrial production now stands at a new all-time high, only recently surpassing the prior high set all the way back in 1991. A 15-year economic stagnation has come to an end, and not surprisingly, Japan's stock market has doubled in the past three years, soaring 45% since last May. What's good for Japan is good for the world, since a more vibrant and spendthrift Japan translates into stronger demand for the world's goods and services. Moreover, an aging Japan will be spending more and more of the savings its people have salted away throughout the world.

Will higher interest rates boost the yen as many seem to think? It will be quite some time before higher interest rates in Japan equate to restrictive monetary policy. For now, higher rates will simply offset higher prices; real interest rates shouldn't change by much. By raising rates, the BoJ will only be offsetting declining demand for yen as deflationary hoarding of yen is gradually replaced by a more normal velocity of circulation. One fundamental limitation on the yen's potential strength is the fact that even though the economy is once again expanding and prices are once again rising, Japan's shrinking population and strict limits on immigration condemn its workforce to decline and that severly limits the ability of the economy to grow. Henceforth, Japanese growth will be all about productivity, not physical expansion.


who's online